9 Best Automated Bug Reporting Tools for Product Teams in 2026
Automated bug reporting tools eliminate the frustration of vague, incomplete bug reports by automatically capturing console logs, session replays, network requests, and device metadata the moment something breaks. This guide compares the 9 best options for product teams in 2026, covering tools that serve different needs—from auto-generating structured tickets from customer conversations to catching production errors before users notice them.
Every support ticket that says "something's broken" is a bug report waiting to be written. The problem is that most of them never get written well. Product teams lose hours chasing vague descriptions, missing reproduction steps, and screenshots that capture nothing useful. Automated bug reporting tools close this gap by capturing the technical context developers actually need: console logs, network requests, session replays, and device metadata, all at the moment something goes wrong.
The tools in this list approach the problem from meaningfully different angles. Some listen to customer conversations and auto-generate structured tickets. Others catch errors in production code before any customer notices. A few focus on helping non-technical people file rich, actionable reports without needing to understand what a stack trace is. Whether you're a SaaS product team drowning in poorly described tickets or a support team trying to bridge the gap between customers and engineering, there's a purpose-built option here.
Selection criteria for this list: integration depth, automation quality, ease of use for non-technical reporters, and overall value for B2B product teams.
1. Halo AI
Best for: B2B SaaS teams that want bug tickets created automatically from customer support conversations
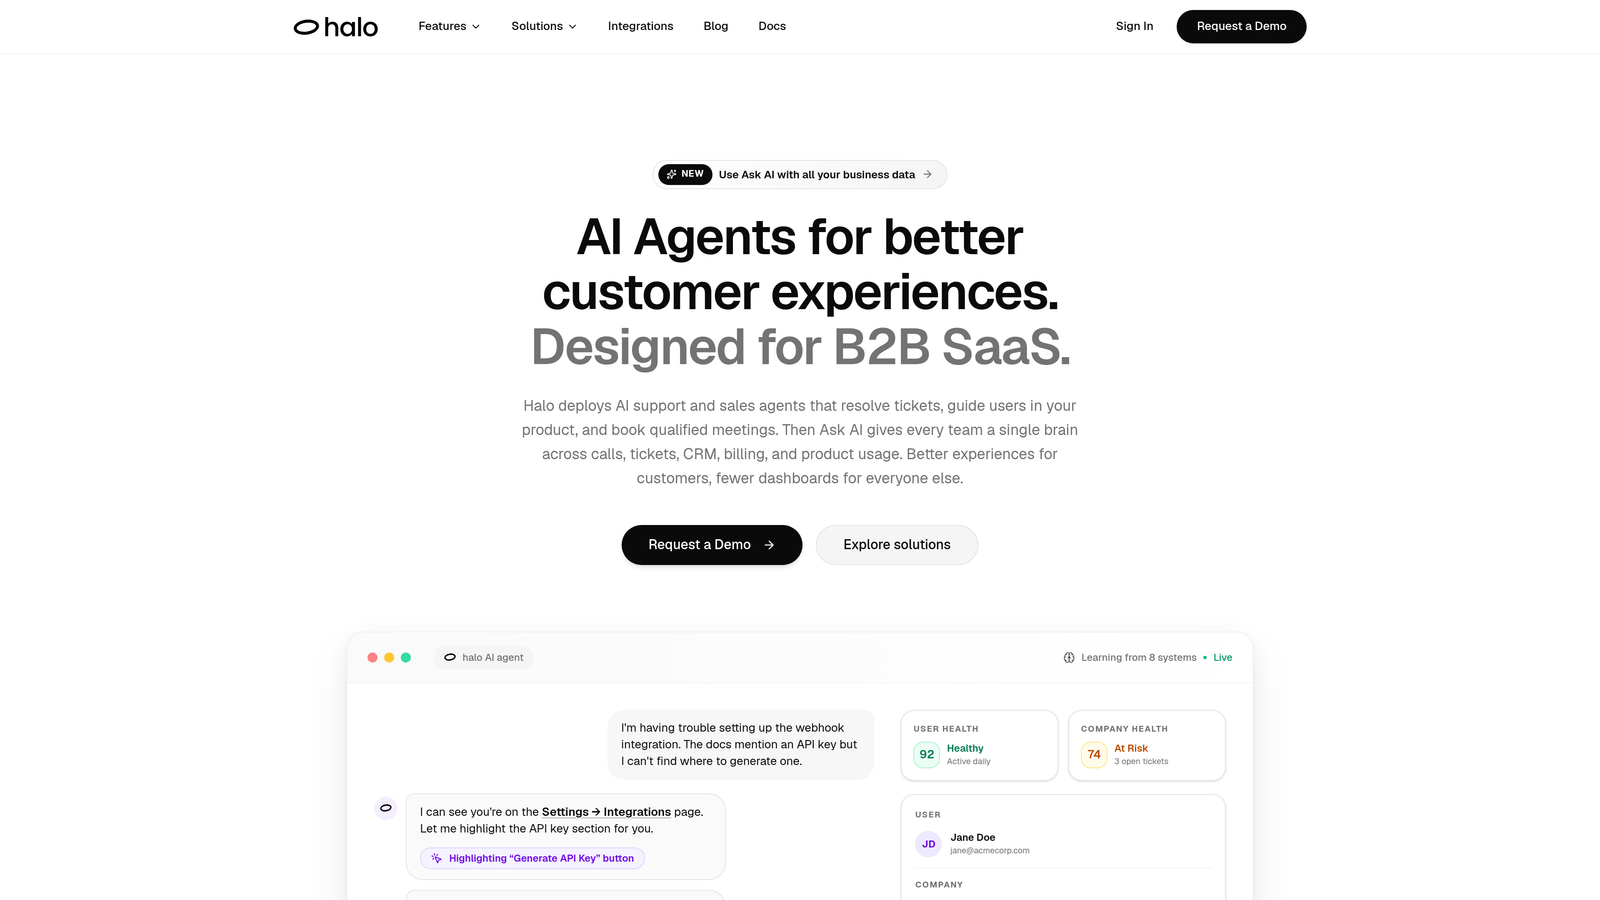
Halo AI is an AI-powered customer support platform that turns support conversations into structured, actionable bug tickets without any manual effort from agents or customers.
Where This Tool Shines
Most bug reporting workflows require someone to stop what they're doing and manually file a ticket. Halo AI removes that step entirely. When a customer reports something broken through the support chat, the AI agent automatically captures the page context, current URL, UI state, and user actions at that exact moment, then creates a structured ticket and pushes it to Linear or Slack with reproduction context already included.
The real differentiator here is that bug reporting becomes a byproduct of support resolution rather than a separate workflow. Engineers receive clean, structured tickets without support agents spending time manually documenting what happened. The system also learns from every interaction, improving bug detection and categorization over time.
Key Features
Auto Bug Ticket Creation: Structured bug tickets are generated directly from customer conversations, with no manual filing required from support agents.
Page-Aware Context: The AI agent captures the current URL, UI state, and user actions at the moment of the report, giving developers a clear reproduction path.
Linear and Slack Integration: Tickets are pushed directly to Linear or Slack with full reproduction context already attached.
Full Customer Context: Connections to HubSpot, Intercom, Stripe, and Zoom mean each bug ticket arrives with relevant customer data alongside the technical details.
Continuous Learning: The AI agent improves bug detection and categorization over time as it processes more interactions.
Best For
B2B SaaS product teams and support teams who want to eliminate the manual handoff between customer-reported issues and engineering tickets. Particularly valuable for teams already using Linear, Slack, or Intercom who want bug reporting to happen as a natural part of the support workflow rather than a separate process.
Pricing
Contact haloagents.ai for current pricing. Built for B2B SaaS teams.
2. Sentry
Best for: Developer teams who want automatic error capture across production code with deep language support
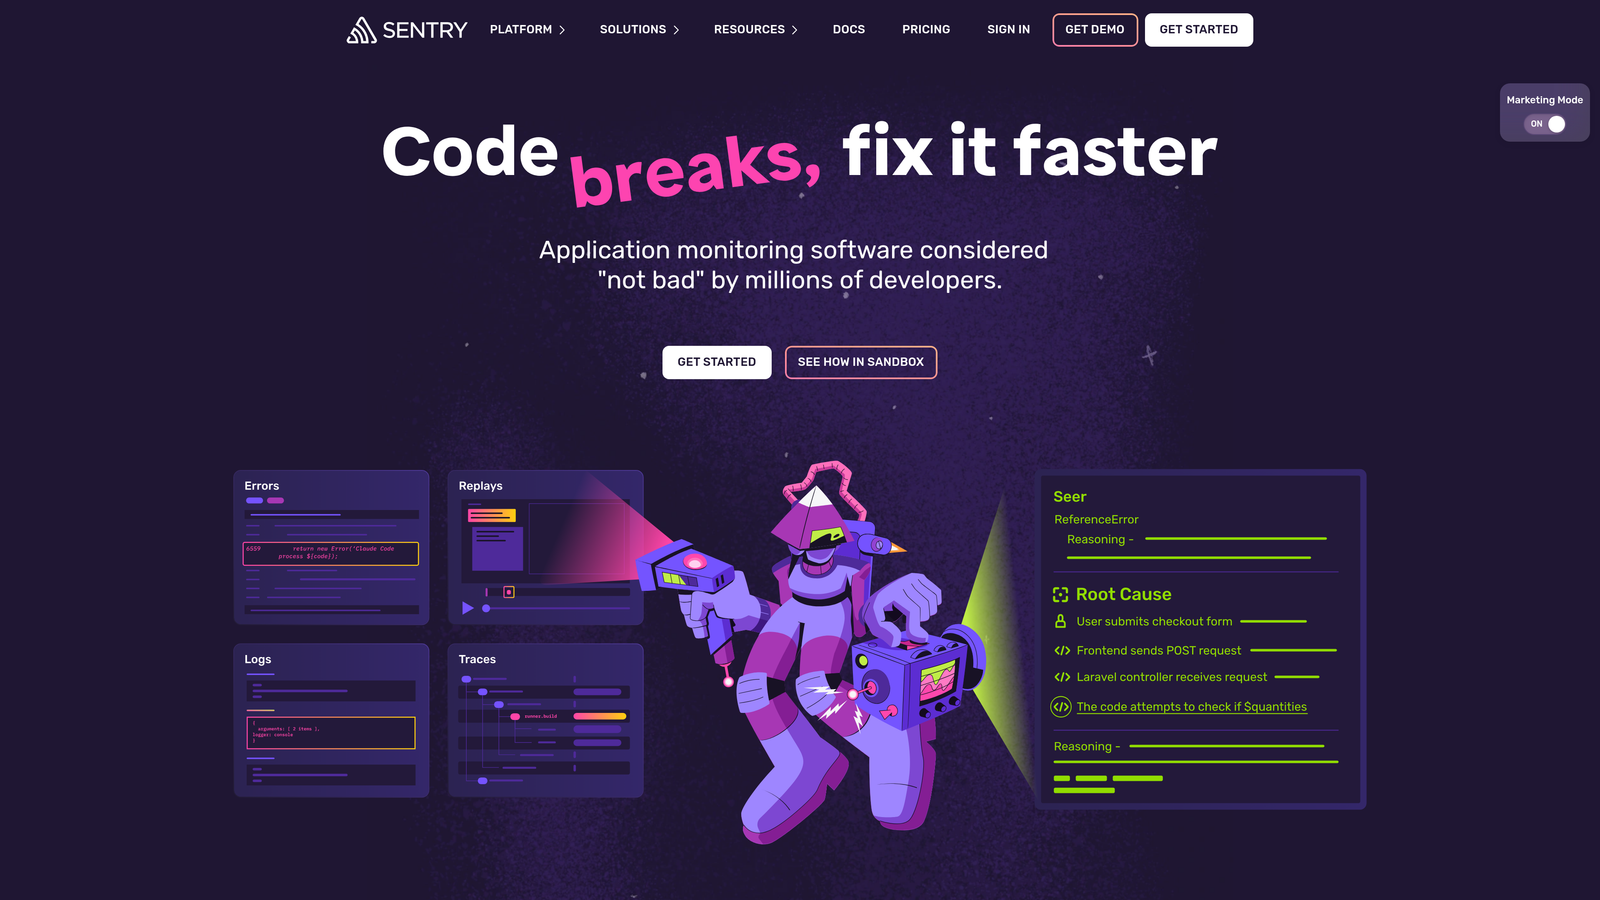
Sentry is a developer-first error monitoring platform that automatically captures exceptions, stack traces, and performance issues in production code across dozens of languages and frameworks.
Where This Tool Shines
Sentry catches bugs before customers have to report them. When an exception fires in production, Sentry captures the full stack trace, a breadcrumb trail of events leading up to the error, and release information showing which deployment introduced the problem. This is especially powerful for teams shipping frequently who need to quickly identify regressions.
The automatic error grouping is worth highlighting. Rather than flooding your inbox with duplicate alerts for the same underlying issue, Sentry intelligently clusters related errors so your team sees unique problems, not noise.
Key Features
Automatic Error Grouping: Duplicate exceptions are clustered together, reducing alert noise and surfacing unique issues clearly.
Breadcrumbs: A chronological trail of events leading to each error gives developers the context they need to reproduce and fix issues faster.
Release Tracking: Pinpoints which deployment introduced a specific bug, making regression identification straightforward.
Performance Monitoring: Error tracking and performance monitoring live in the same platform, avoiding the need for a separate APM tool.
Integrations: Native connections to GitHub, Jira, Linear, and Slack fit into most existing development workflows.
Best For
Engineering teams who want automatic error detection in production code without relying on customer reports. Works well across web, mobile, and backend applications. The broad language support makes it a strong choice for teams with diverse tech stacks.
Pricing
Free tier available for small projects. Paid plans start at $26/month for teams, scaling with event volume.
3. Jam
Best for: Non-technical reporters who need to file rich bug reports without understanding what they're capturing
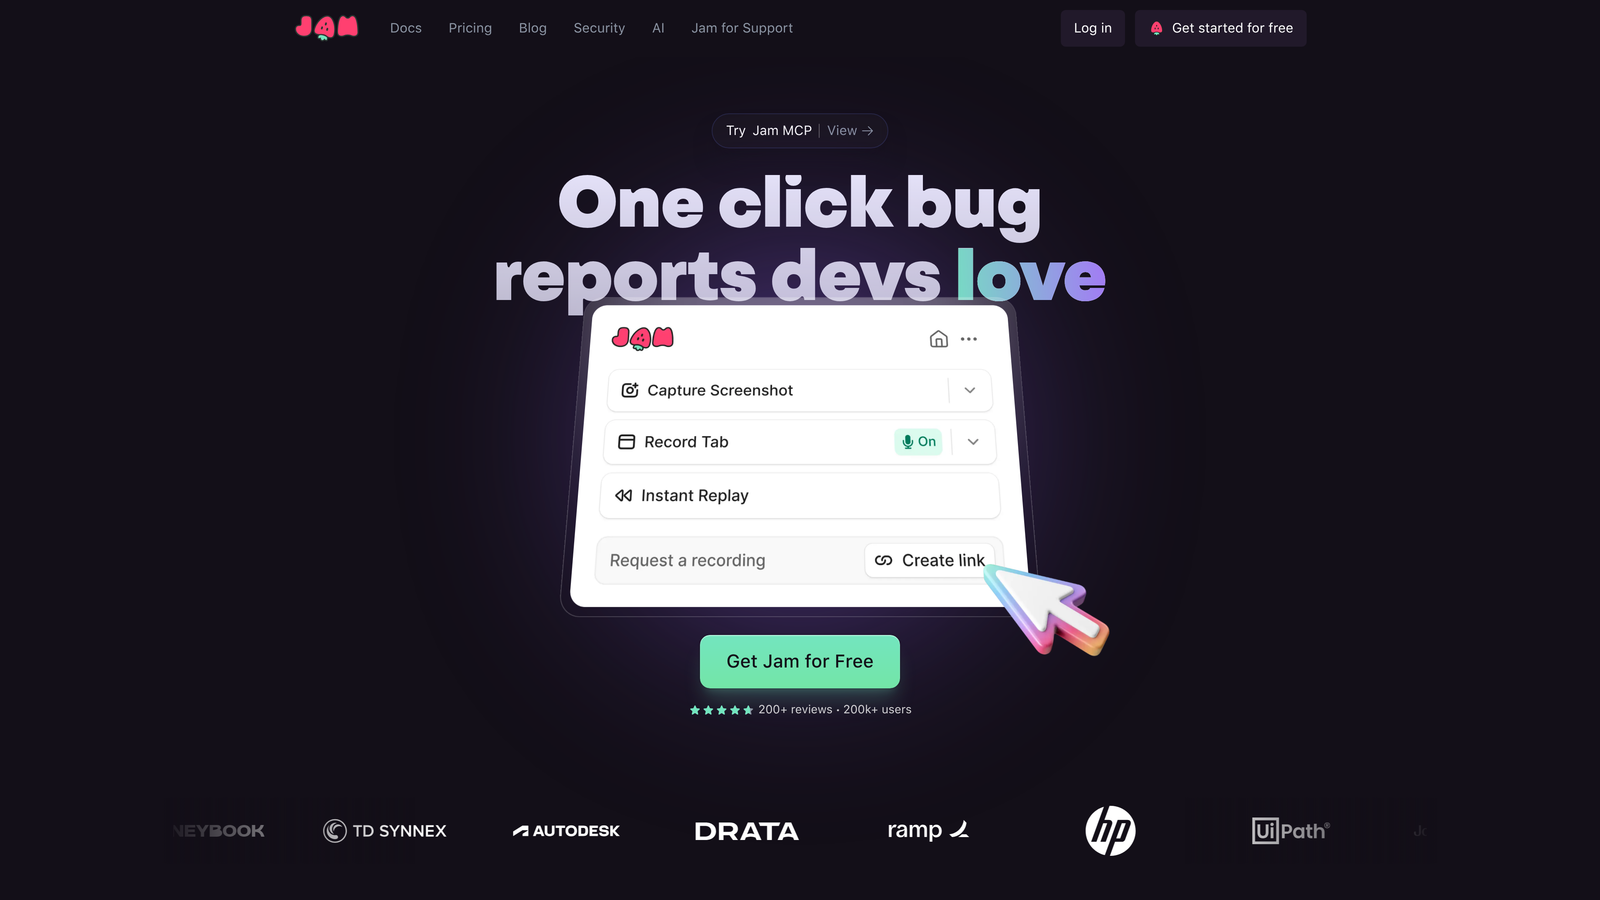
Jam is a browser extension that lets anyone file a technically complete bug report in one click, automatically capturing console logs, network requests, browser info, and a screen recording without the reporter needing any technical knowledge.
Where This Tool Shines
The gap Jam closes is a familiar one: a support agent or customer success manager sees a bug but doesn't know how to capture what a developer actually needs. With Jam, they click one button. The extension handles everything else, recording the screen, grabbing console output, and logging network requests in the background. The reporter fills out a simple form; the developer receives a complete technical package.
This makes Jam particularly effective for customer success and support teams who regularly file bugs on behalf of customers. There's no training required and no risk of a reporter forgetting to attach the right information.
Key Features
One-Click Reporting: A single button press triggers automatic capture of all relevant technical data alongside a screen recording.
Automatic Console and Network Capture: Logs and network requests are collected without the reporter needing to open developer tools.
Simple Reporter Experience: The person filing the bug sees only a clean form; the technical complexity is entirely hidden.
Wide Integrations: Connects to Jira, Linear, GitHub Issues, Asana, Trello, and Slack for flexible workflow routing.
Screen Recording Included: Every report automatically includes a video of what the reporter was doing, removing ambiguity about what happened.
Best For
Support teams, customer success teams, and QA teams where reporters lack technical backgrounds. Also useful for product teams who want to standardize how bugs are reported internally without enforcing a technical process.
Pricing
Free tier available. Paid plans for larger teams; check jam.dev for current pricing.
4. LogRocket
Best for: Product teams who want session replay combined with error tracking and product analytics in one platform
LogRocket is a session replay and error tracking platform that records pixel-perfect user sessions and automatically surfaces errors tied to specific user journeys, combining bug detection with product analytics.
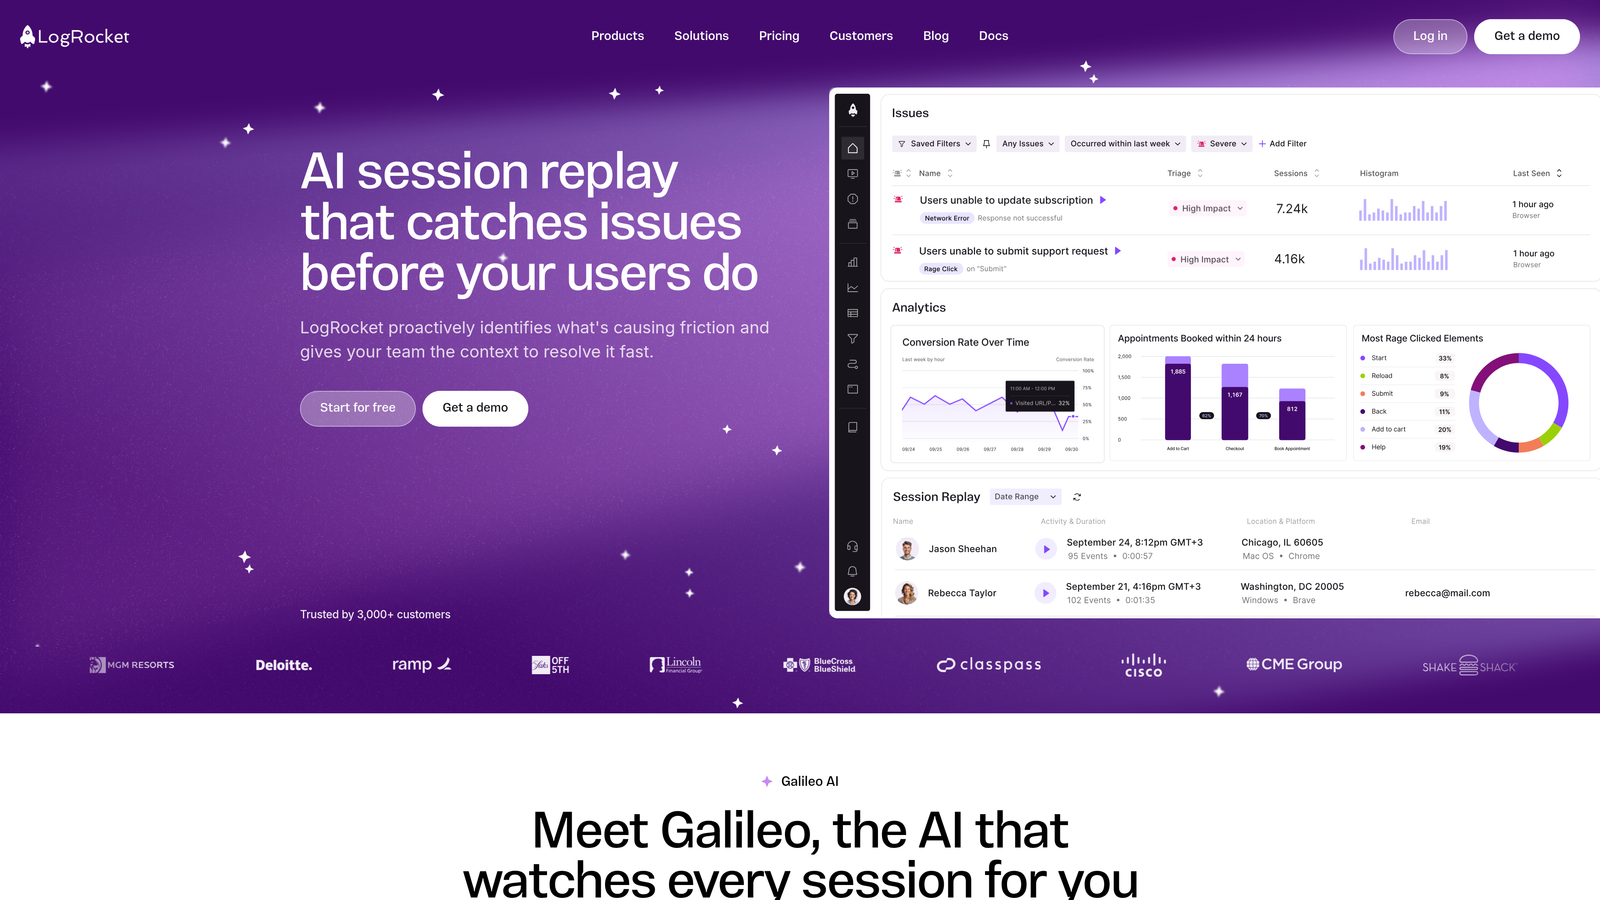
Where This Tool Shines
LogRocket's strength is connecting a bug to the exact user experience that preceded it. Instead of looking at a stack trace in isolation, you can watch a replay of exactly what the user saw and did, including frontend state from Redux or Vuex, right up to the moment the error occurred. This removes a significant amount of back-and-forth between support, product, and engineering.
The product analytics layer adds another dimension. LogRocket can show you not just that an error happened, but which errors are causing users to drop off or abandon a workflow, helping teams prioritize fixes by actual business impact rather than error frequency alone.
Key Features
Pixel-Perfect Session Replay: Replays show exactly what the user saw, not a reconstruction, giving developers an accurate picture of the bug environment.
Automatic Error Detection: Errors are automatically tied to the specific sessions in which they occurred, making reproduction straightforward.
Redux and Vuex State Capture: Frontend application state is recorded alongside the session for deep debugging context.
Product Analytics: Funnels, user paths, and retention analysis sit alongside error data, connecting bugs to user behavior patterns.
Frustration Signals: Identifies rage clicks, dead clicks, and error-related drop-off to surface the bugs causing the most user friction.
Best For
Growth-stage SaaS product teams who want a single platform for session replay, error tracking, and product analytics. Particularly valuable when the goal is understanding which bugs are hurting conversion or retention, not just which errors are firing most frequently.
Pricing
Free tier available. Paid plans scale with session volume; check logrocket.com for current pricing.
5. BugHerd
Best for: Web agencies and teams managing client QA feedback on website projects
BugHerd is a visual bug reporting tool for website projects that lets reviewers click directly on any webpage element to attach a bug note, with browser and environment metadata captured automatically.
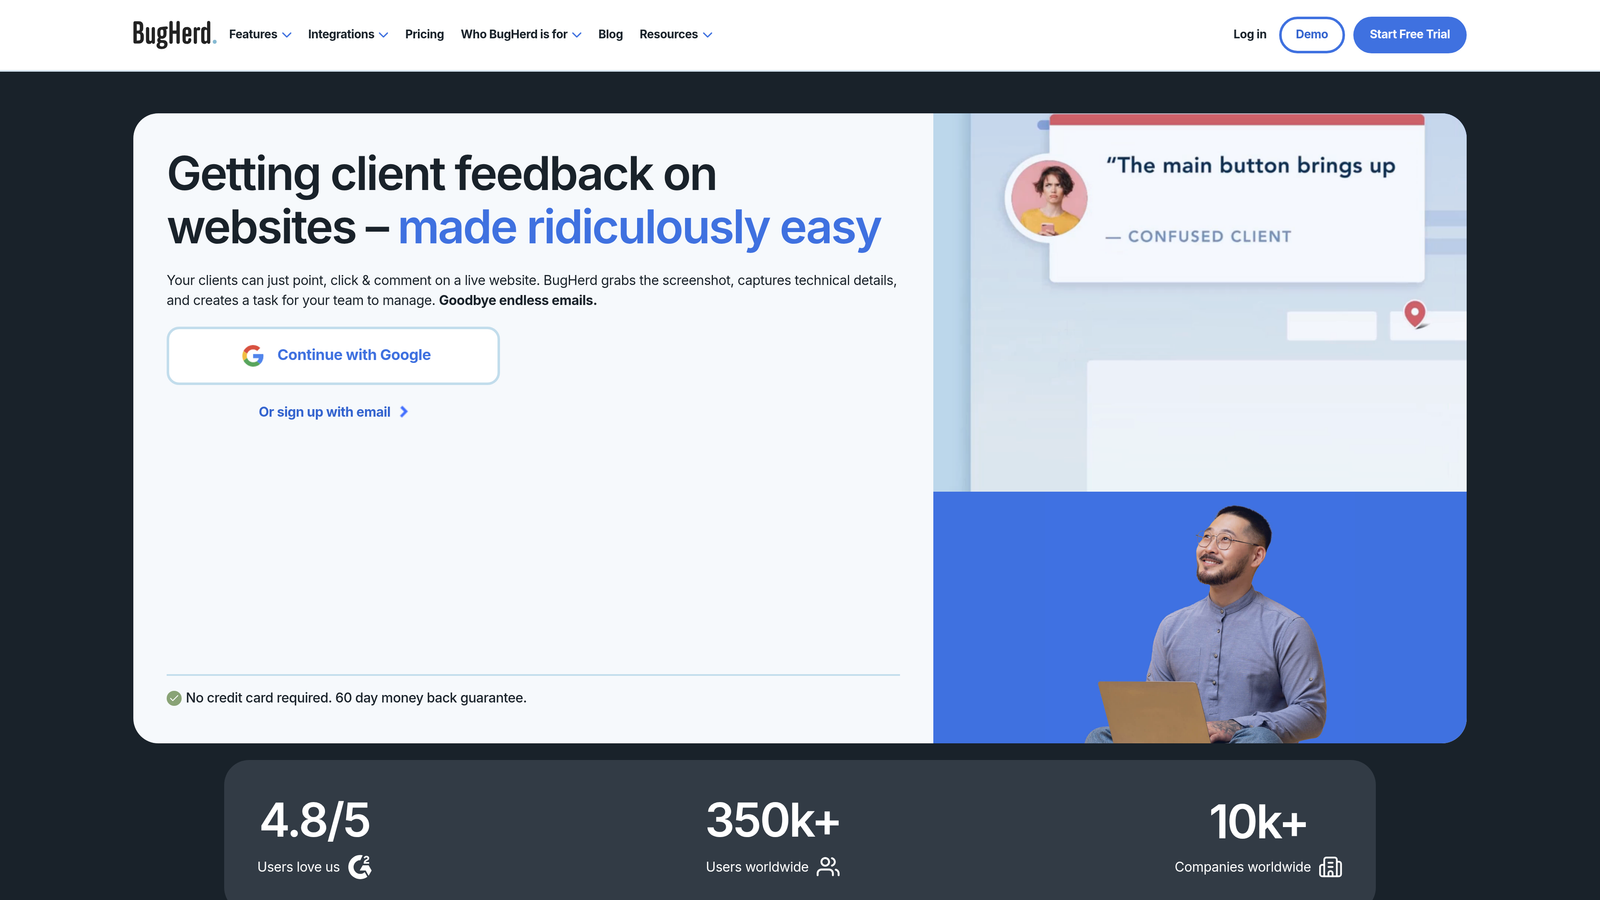
Where This Tool Shines
BugHerd is built for the scenario where non-technical stakeholders, often clients or project reviewers, need to give precise feedback on a website without knowing how to describe what they're seeing technically. Clicking on the exact element that's broken and leaving a note is intuitive for anyone. The tool then records the CSS selector path, browser, OS, screen resolution, and URL automatically, so developers know exactly where to look.
The built-in Kanban board keeps everything organized without requiring a separate project management tool, which makes it a practical choice for agencies managing multiple client projects simultaneously.
Key Features
Point-and-Click Bug Pinning: Reviewers click directly on the problematic element on a live webpage to attach their feedback.
Automatic Environment Capture: Browser, OS, screen resolution, and URL are recorded without any action from the reporter.
CSS Selector Path: Developers receive the exact element path, removing any guesswork about which element is affected.
Kanban Task Board: Reported bugs flow into a built-in board for tracking and managing resolution progress.
Guest Access: Clients can submit feedback without creating an account, reducing friction in client review workflows.
Best For
Web development agencies and teams doing client UAT or website QA. Less suited for monitoring production SaaS applications; better suited for structured review cycles on website and web app projects.
Pricing
Plans start around $39/month. Project-based pricing available; check bugherd.com for current plans.
6. Datadog Error Tracking
Best for: Engineering teams already on Datadog who want error tracking correlated with APM, logs, and infrastructure data
Datadog Error Tracking is an error tracking module within the Datadog observability platform that correlates frontend and backend errors with APM traces, logs, and infrastructure metrics for full-stack context.
Where This Tool Shines
The core value proposition here is correlation. When an error fires, Datadog can connect it to the backend trace that was running at the same time, the logs generated by that service, and the infrastructure metrics for the host handling the request. For teams debugging complex, distributed systems, this level of context is difficult to replicate by stitching together separate tools.
If your team is already using Datadog for infrastructure monitoring or APM, adding error tracking is a natural extension rather than a new tool to evaluate, integrate, and maintain. The value compounds with existing Datadog investment.
Key Features
Full-Stack Correlation: Errors are linked to backend traces, logs, and infrastructure metrics for complete debugging context.
Automatic Error Fingerprinting: Related issues are grouped together to surface unique problems rather than duplicate alerts.
Deployment Tracking: Error trends are tracked across deployments and environments to identify regressions quickly.
Native Platform Integration: Works seamlessly with all other Datadog products, including APM, logs, dashboards, and alerting.
SLO and Alerting: Built-in alerting and SLO tracking connect error rates to reliability targets.
Best For
Engineering and DevOps teams already invested in the Datadog ecosystem. The pricing and complexity make it less practical as a standalone bug reporting tool for smaller teams, but it's a strong choice for organizations where observability is already centralized in Datadog.
Pricing
Usage-based pricing. Best value for teams already on Datadog; check datadoghq.com for current rates.
7. Marker.io
Best for: Teams collecting bug reports from clients or stakeholders who need a simple annotation experience
Marker.io is an embeddable feedback widget that collects bug reports from clients and stakeholders through a simple annotation form while silently capturing technical metadata in the background.
Where This Tool Shines
Marker.io occupies a similar space to BugHerd but with a stronger focus on internal product teams and a wider range of project management integrations. The widget embeds directly into a web application, and reporters can annotate their screenshot, leave a comment, and submit in a matter of seconds. Meanwhile, the tool silently collects console logs, network activity, and browser information that the reporter never sees.
The guest reporting capability is particularly useful for client UAT scenarios. Clients don't need to create accounts, which removes a common friction point in feedback collection workflows.
Key Features
Embeddable Widget: Installs in any web application and requires no technical knowledge from the person reporting the bug.
Silent Technical Capture: Console logs, network activity, and browser metadata are collected in the background without disrupting the reporter's experience.
Screen Annotation: Reporters can mark up their screenshot to show exactly where the problem appears.
Broad Integrations: Connects to Jira, Trello, GitHub, Asana, ClickUp, and Monday.com for flexible ticket routing.
Guest Reporting: External clients and stakeholders can submit reports without creating a Marker.io account.
Best For
Product teams managing client UAT, agencies running feedback cycles, and internal teams who want a low-friction way to collect bug reports from non-technical stakeholders. Works well alongside a dedicated error monitoring tool rather than as a replacement for one.
Pricing
Free trial available. Paid plans per workspace; check marker.io for current pricing.
8. Instabug
Best for: Mobile app teams who need in-app bug reporting and crash reporting for iOS and Android
Instabug is a mobile-first bug reporting and crash reporting SDK that captures device context, network logs, and annotated screenshots when mobile app users shake their device or trigger a report.
Where This Tool Shines
Mobile bug reporting has a unique challenge: users can't open a browser console or install a browser extension. Instabug solves this with a shake-to-report gesture that triggers an in-app form, automatically pulling device model, OS version, battery level, network type, and repro steps without requiring any technical input from the user. This is the kind of context mobile developers actually need to reproduce issues on specific device configurations.
The crash reporting layer adds proactive detection alongside the user-triggered reports, giving mobile teams both reactive and automatic coverage in a single SDK.
Key Features
Shake-to-Report: A simple gesture triggers the bug report form with automatic technical data capture, making it accessible to any app user.
Device Context Capture: Device model, OS version, battery level, and network type are automatically recorded with every report.
Screen Annotation: Users can mark up a screenshot of the exact problem area before submitting.
Crash Reporting: Automatic crash detection with full stack traces for iOS and Android runs alongside user-triggered reports.
Cross-Platform Support: Works with React Native, Flutter, and Xamarin in addition to native iOS and Android.
Best For
Mobile app development teams who need both proactive crash reporting and user-triggered bug reporting in a single SDK. Particularly valuable for teams with diverse device targets where capturing hardware and OS context is critical for reproduction.
Pricing
Usage-based pricing. Free trial available. Enterprise plans for larger teams; check instabug.com for current rates.
9. Raygun
Best for: Product teams who want to prioritize bug fixes by actual user impact rather than error frequency
Raygun is a crash reporting and real user monitoring platform that prioritizes bugs by the number of affected users, helping product teams focus engineering effort on issues with the greatest business impact.
Where This Tool Shines
Raygun's defining feature is the Affected Users metric. Most error monitoring tools tell you how often an error fires. Raygun tells you how many unique users are experiencing it. This distinction matters significantly when triaging a bug backlog: an error that fires 10,000 times for one automated process is less urgent than an error that fires 50 times for 50 different paying customers.
The real user monitoring layer complements this by connecting error data to actual user sessions, so teams can see both the technical details of a bug and the user experience context around it in one place.
Key Features
Affected Users Metric: Surfaces which bugs are impacting the most unique users, enabling business-impact-based prioritization rather than frequency-based triage.
Real User Monitoring: Combines crash reporting with RUM data in a single platform for connected technical and user experience context.
Smart Grouping: Clusters related errors to surface unique issues rather than flooding teams with duplicate alerts.
Integrations: Connects to Jira, GitHub, Slack, and PagerDuty for flexible alerting and workflow routing.
Web and Mobile Support: Covers both web applications and mobile apps in one platform.
Best For
Product teams who want to connect bug severity to user impact and make data-informed decisions about which fixes to prioritize. Works well for SaaS teams where understanding which errors affect paying customers is more important than raw error volume.
Pricing
Priced by monthly active users. Plans available for teams of all sizes; check raygun.com for current pricing.
Which Tool Is Right for Your Team?
The right tool depends heavily on where bugs enter your workflow and who's responsible for capturing them.
Support-driven teams: If bugs surface through customer conversations before they're caught in code, Halo AI is the strongest option. It's the only tool here that creates structured bug tickets automatically from support interactions, meaning engineers get actionable reports without support agents manually filing anything.
Developer-led error monitoring: For teams who want to catch errors in production code before customers notice, Sentry is the most accessible starting point. Datadog Error Tracking is the right choice if your team is already in the Datadog ecosystem. Raygun is worth a look if prioritizing bugs by affected users is a priority.
Non-technical reporters: Jam is the simplest option for support or customer success teams filing bugs on behalf of customers. Marker.io and BugHerd serve similar needs for client feedback and UAT workflows, with BugHerd leaning more toward web agency projects and Marker.io offering broader project management integrations.
Mobile teams: Instabug is the clear choice. There isn't a comparable tool in this list for mobile-specific in-app reporting and crash capture.
Session replay needs: LogRocket is the strongest option for teams who want to watch exactly what a user experienced before a bug occurred, especially when that context needs to connect to product analytics.
Many teams end up running two tools in parallel: an error monitoring platform for proactive detection and a support-side tool for customer-reported issues. See Halo in action to explore how AI agents can handle the support side of bug reporting automatically, turning every customer conversation into structured engineering context without adding work for your team.