Customer Service Data Analytics Guide for B2B Teams
Learn customer service data analytics from metrics to dashboards. Turn CSAT, FRT and resolution data into churn prediction and growth.
 Grant CooperFounder14 min read
Your B2B support queue is getting busier, yet customer satisfaction hasn't moved. Agents say the same accounts keep returning with similar problems, managers see response times changing from day to day, and executives want to know whether support activity is protecting renewals. The dashboard shows movement, but it doesn't explain what anyone should do next.
That's where customer service data analytics earns its place. It turns conversations, timestamps, outcomes, and customer feedback into signals that help support leaders decide where to add capacity, which workflows to fix, when to involve customer success, and when an automated answer should stop and hand the case to a person.
A useful analytics program isn't just a collection of charts. It connects service activity to customer experience, operational cost, retention risk, and revenue context. This guide follows that path, starting with the basic data model, then moving through metrics, governance, dashboards, practical use cases, and real-time decisioning. It's designed for support operations managers, customer service leaders, SaaS founders, and cross-functional teams that need a reliable way to act on service signals.
If you're also evaluating how AI can interpret those signals, this overview of AI for customer service insights provides useful context. The central principle is simple: analytics should shorten the distance between an interaction and a better decision.
Introduction to Customer Service Data Analytics
A support manager might see a growing ticket count and conclude that the team needs more agents. That may be true, but the queue alone can't tell you whether the problem is a product defect, outdated documentation, slow internal approvals, poor routing, or customers reopening cases that agents marked as resolved.
Customer service data analytics separates those possibilities. It connects the original customer request with the channel, timestamps, assigned team, knowledge article, escalation path, resolution status, follow-up contacts, and feedback. Instead of asking, “How many tickets did we close?” the manager can ask, “Which issue types create repeat work, which customers are affected, and what intervention will remove the cause?”
From activity reporting to operational decisions
Customer service analytics is built around measurable interaction data across phone, email, chat, social, and survey channels. Common operational metrics include first response time, resolution rate, CSAT, and NPS, because these measures convert service interactions into comparable signals that teams can track over time and across channels, as explained in Salesforce's customer service analytics overview.
The value appears when a team connects a metric to an owner and a response. A falling first response time may trigger staffing changes. A weak resolution rate for one product area may send examples to product engineering. A cluster of low CSAT responses from renewal-stage accounts may alert customer success before a commercial conversation becomes difficult.
Practical rule: A metric becomes useful only when someone knows what decision it should change.
Consider a B2B software company whose administrators ask repeated questions about user permissions. A dashboard might show acceptable average response performance. Deeper analysis could reveal that agents answer quickly but transfer many cases to implementation specialists, and customers then reopen the tickets because the original explanation didn't match their setup. The right intervention isn't necessarily faster replies. It may be clearer documentation, better CRM context, a product usability fix, or an explicit handoff rule.
That's the outcome this guide targets: a support operation that uses everyday interactions as evidence. You'll learn how to define the signals, protect their quality, design decision-oriented views, and connect service analytics with CRM and revenue workflows without allowing automation to hide unresolved customer problems.
How Customer Service Data Analytics Works
Think of your support operation as an air traffic control system. Phone calls, emails, chats, social messages, and surveys are aircraft sending separate signals. Each channel has its own format, timing, and destination. Analytics acts as the control tower, bringing those signals into one view so managers can see congestion, missed handoffs, and emerging risk.
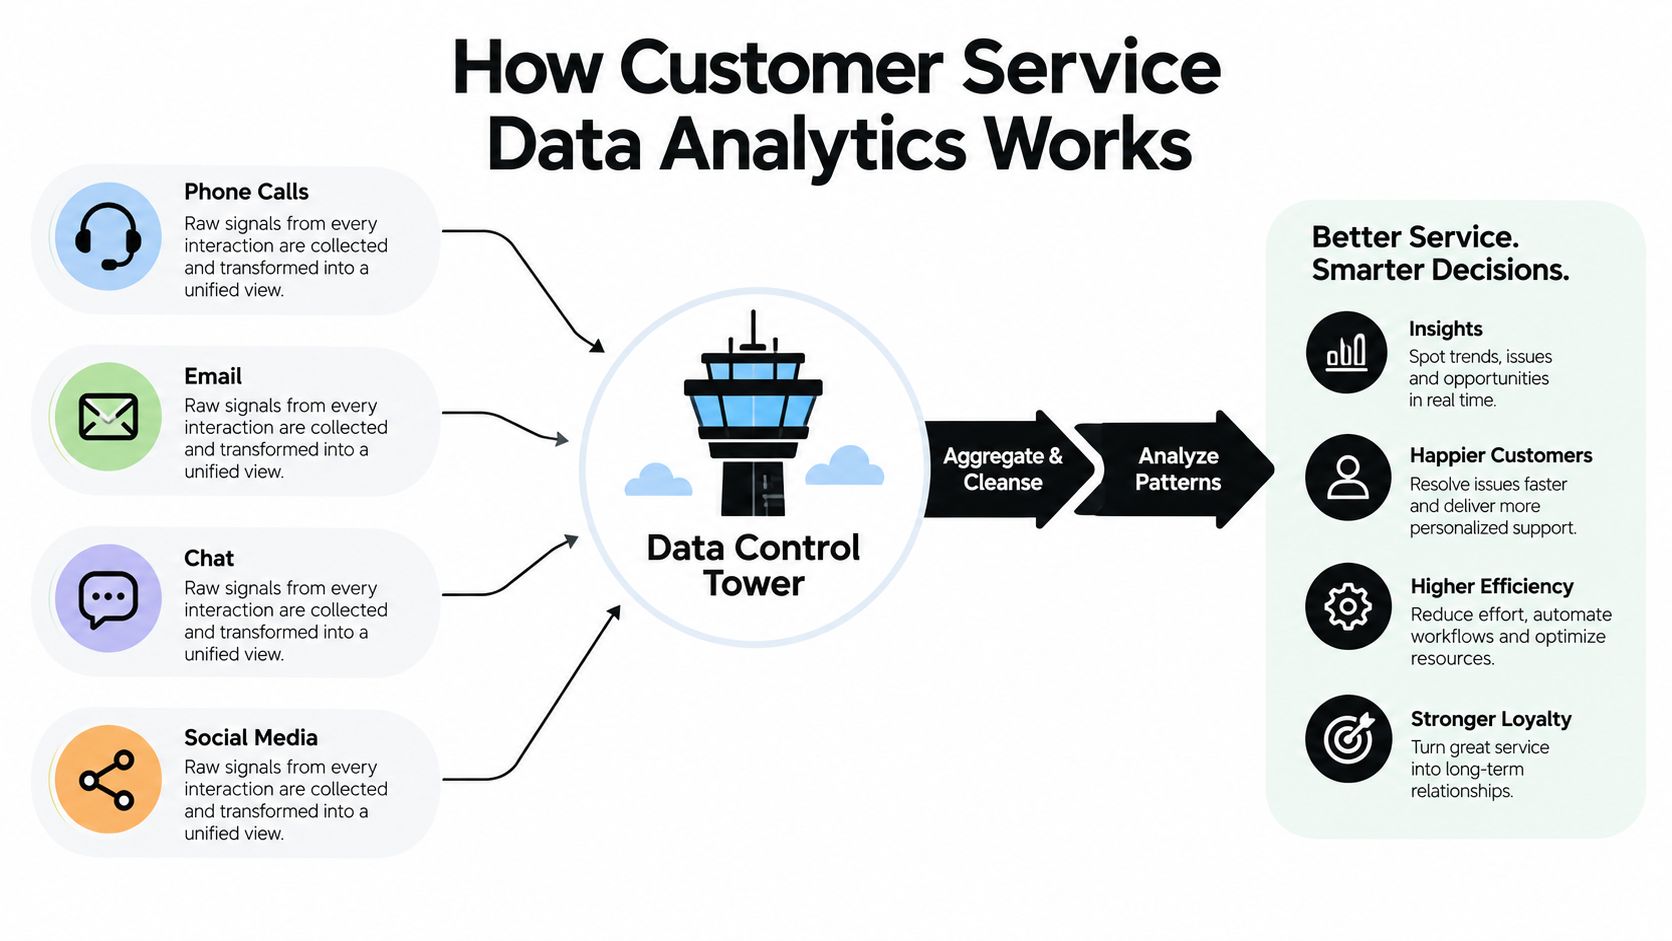
Start with the raw event. A customer sends an email, opens a chat, receives a reply, clicks a help article, calls an agent, or submits a survey. Each event should carry enough context to identify the customer, conversation, channel, time, product area, and outcome.
Three layers of meaning
The next layer is normalization. A phone call may contain a start time, end time, transfer, and disposition. An email has message timestamps and a later resolution event. A chat may include several messages within one session. If your team treats every channel as if it behaves like a live call, the resulting comparison will be misleading.
Use three layers to keep the model clear:
- Raw events record what happened, such as a ticket creation, agent reply, transfer, reopen, or survey response.
- Aggregated metrics summarize those events, such as median first response time, resolution rate, or CSAT by queue.
- Operational insights explain what deserves action, such as a knowledge gap causing repeat contacts from enterprise administrators.
The distinction matters because a metric can be mathematically correct and operationally wrong. If a ticket is marked closed while the customer continues replying in the same thread, a closure report may look healthy while the customer experience deteriorates. Analytics must preserve the sequence of events, not just the final status.
A consistent data dictionary should define terms such as “first meaningful reply,” “resolved,” “reopened,” “escalated,” and “deflected.” Teams exploring broader customer patterns can also review predictive customer analytics, but prediction only becomes dependable when the underlying events have consistent definitions.
The practical workflow is therefore straightforward: collect, normalize, aggregate, interpret, act, and validate. The final step is essential. After a workflow changes, compare the new outcome with the original signal and check whether the customer experience improved, not merely whether the dashboard became quieter.
Key Metrics That Define Service Performance
A B2B customer opens a ticket about an integration failure. The reply arrives quickly, but the case is transferred twice and reopened the next day. A dashboard that reports only response speed may label this interaction healthy. Service analytics should connect speed, effort, outcome, and account context so managers can decide what to change and when another system, such as the CRM, needs a handoff.
First response time measures how long a customer waits for a meaningful agent reply after making contact. Its standard calculation divides total first-response time across engaged conversations by the number of engaged conversations, while accounting for operating hours, as explained in this first response time definition. Compare this metric within the same channel and schedule. A chat queue and an email queue do not create comparable waiting conditions.
First Contact Resolution, or FCR, asks whether the issue was fully solved during the first interaction, without a callback, transfer, or reopen. Industry benchmark ranges commonly cluster around 70% to 79%, while 80% or higher is described as world-class in FCR benchmark guidance. The same source connects a one percentage point improvement in FCR with roughly a one percentage point increase in CSAT, and notes that satisfaction can fall by about 15% when a customer must call back about the same issue. Treat these figures as comparison signals, not automatic targets. A team should first confirm that agents record transfers, reopenings, and repeat contacts consistently.
What each metric helps you decide
CSAT records the customer's immediate reaction after an interaction. Teams commonly collect it on a 1-to-5 or 1-to-10 scale, according to this customer service analytics reference. Break results down by queue, issue, agent, channel, and account segment. An overall average can hide repeated failures for a strategic B2B account.
Resolution rate measures cases reaching a defined resolved state. Validate it against reopenings and repeat contacts. A high rate paired with frequent reopenings may show that agents are closing records before the customer's problem is fixed.
Mean time to resolution, or MTTR, measures elapsed time from issue creation to resolution. Segment it by complexity and channel because a live chat, an asynchronous email case, and a technical escalation follow different paths. A shorter MTTR is useful only when resolution quality remains stable.
NPS reflects willingness to recommend at the relationship level. Use it alongside interaction measures, especially when account teams need to connect service patterns with renewal risk or expansion conversations.
| Metric | What It Measures | Decision Use |
|---|---|---|
| First response time | Time to the first meaningful agent reply | Adjust staffing or service expectations within comparable channels |
| FCR | Issues resolved during the first interaction | Investigate repeat contacts, transfers, and missing knowledge |
| CSAT | Immediate satisfaction after an interaction | Locate friction by issue, channel, segment, and resolution path |
| Resolution rate | Cases reaching a valid resolution state | Check closure quality against reopenings |
| MTTR | Time from contact creation to true resolution | Find delays after separating complexity and channel |
| NPS | Relationship-level willingness to recommend | Give CRM and account teams context for customer health |
Avoid choosing one master KPI. Speed can improve while resolution quality declines, and deflection can rise while customers struggle with inaccurate answers. FCR can also appear stronger when agents avoid recording cases that should enter the support workflow. A balanced scorecard exposes these false positives.
Connect thresholds to action. A spike in response time can trigger queue rebalancing. Repeated contacts for one product area can create a knowledge or engineering handoff. A low CSAT score from a strategic account can notify the CRM owner, while governance rules require human review before revenue decisions are made. For a broader operational reference, see this guide to customer support metrics.
Data Sources Instrumentation and Governance
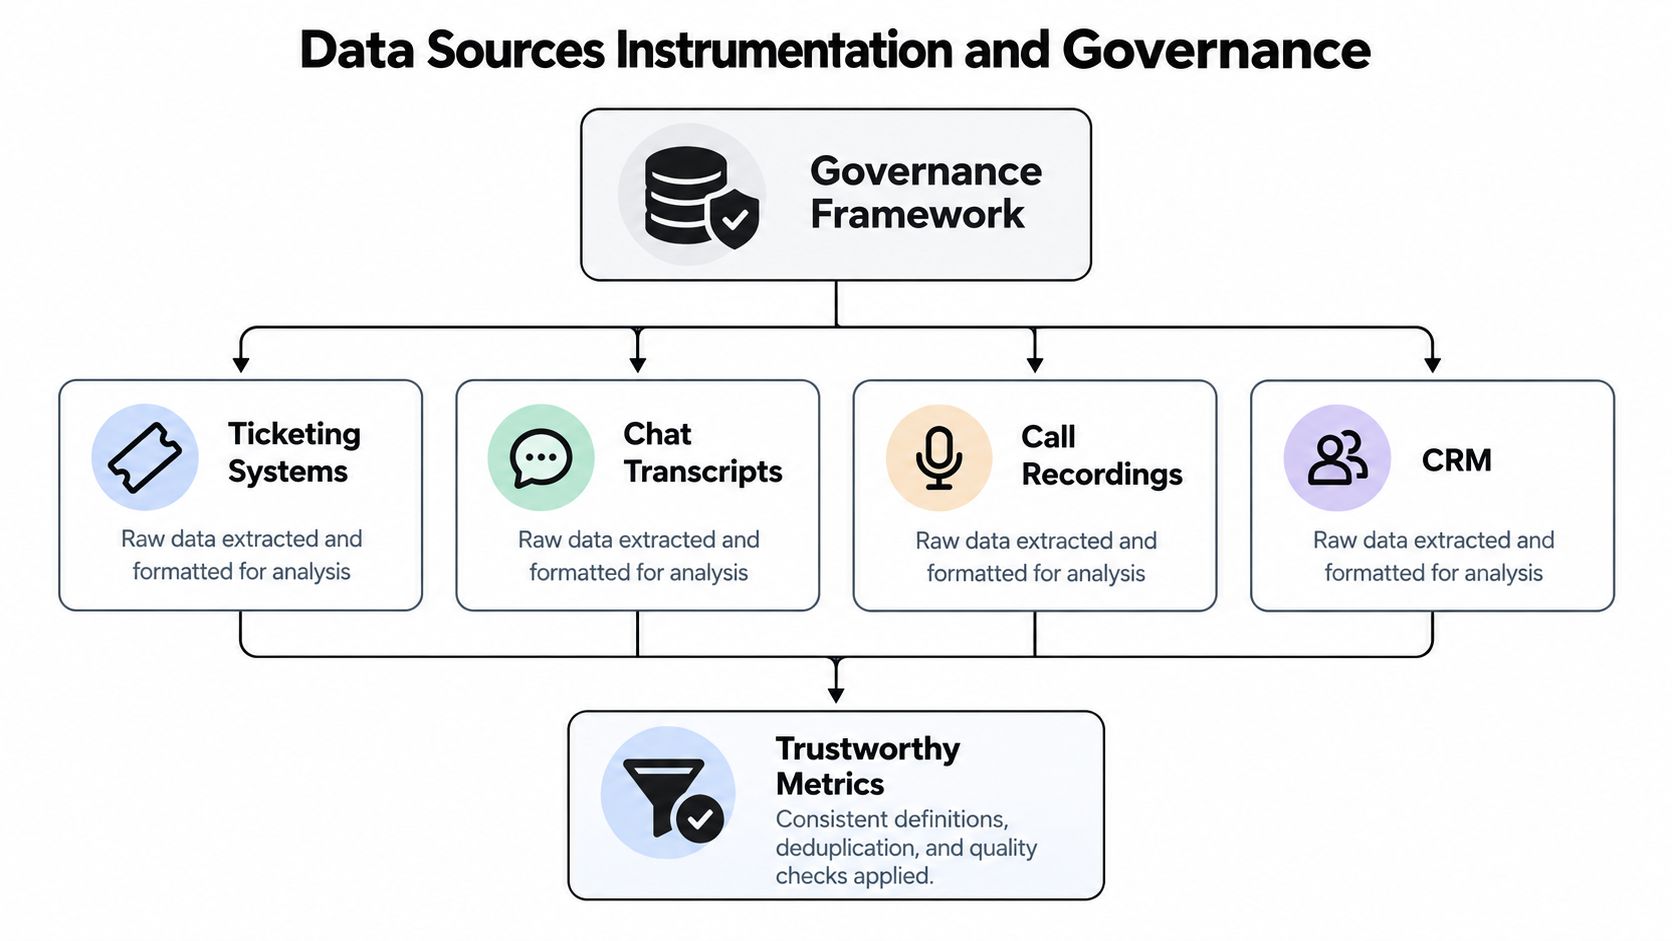
Reliable analytics begins before the dashboard. Your ticketing system, chat transcripts, call recordings, CRM, self-service portal, and survey platform each capture part of the customer story. If those systems use different customer identifiers, time zones, status labels, or definitions of resolution, the reporting layer will join fragments that don't belong together.
A support operations team should map the data flow before selecting new charts. Identify where each event originates, who owns it, how often it updates, and what happens when the record changes. A CRM may contain account tier and renewal timing, while the ticketing platform contains the interaction history. A self-service portal records article engagement, but it shouldn't call an interaction successful unless the customer avoided creating a ticket under a defined rule.
Instrument the events that affect interpretation
Timestamp accuracy is foundational. For email and web-submitted tickets, one industry-standard interpretation allows resolution within one business hour to count as first-contact resolution, according to the ICMI guidance on customer satisfaction and FCR. That interpretation makes queue-state tracking, operating-hours logic, and channel normalization essential.
Governance should answer practical questions:
- What counts as a response? Exclude automated acknowledgments if the metric is intended to measure a meaningful agent reply.
- What counts as resolved? Require a customer-facing outcome, not only an internal status change.
- How are reopened cases handled? Preserve the original resolution and record the subsequent contact as a new event or a failed outcome, based on a documented rule.
- How are transfers represented? Keep the full handoff chain so managers can find routing and knowledge gaps.
- Who owns definitions? Assign responsibility for the data dictionary, metric changes, and exception reviews.
A simple audit can expose major distortions. Sample closed tickets from each channel, trace their event history, compare displayed timestamps with source records, and check whether account identity persists across systems. Then test whether a reported deflection corresponds to a customer who solved the issue, rather than someone who abandoned a page.
Teams responsible for ongoing validation can use a process for data quality monitoring. The objective isn't perfect data in the abstract. It's data that remains consistent enough for a manager to trust an alert and act without creating another problem.
Building Dashboards That Drive Action
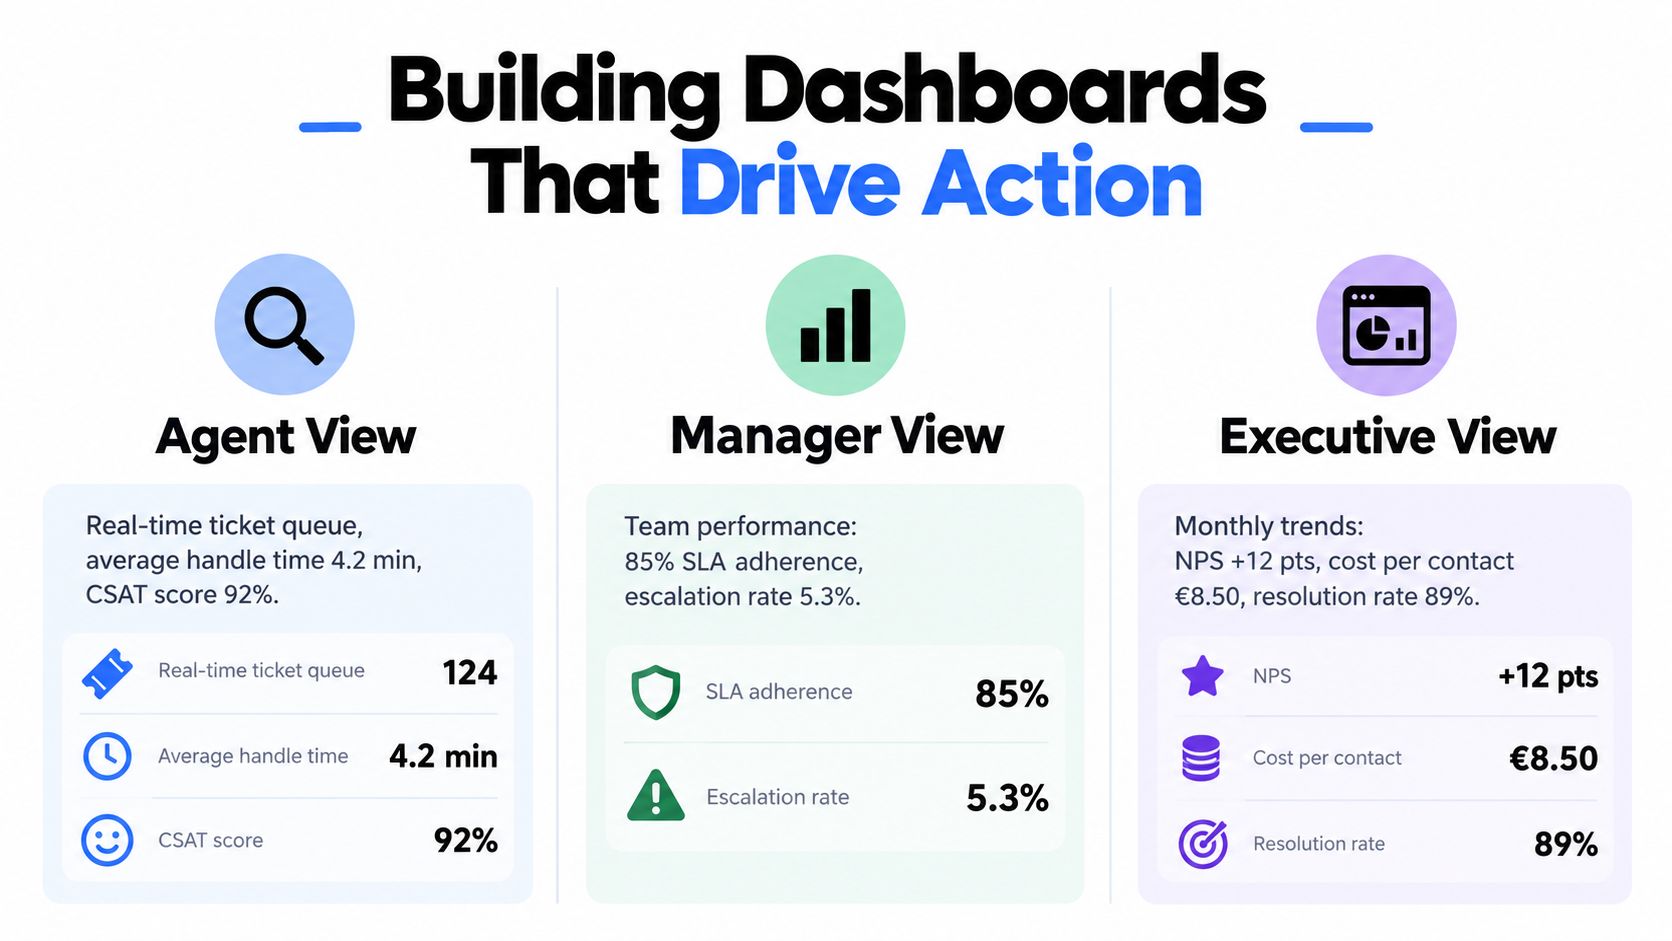
A dashboard should help a named person make a decision during a defined operating rhythm. An agent needs to know which conversation requires attention now. A manager needs to find bottlenecks and allocate work. An executive needs to understand whether service quality supports retention and revenue. One screen can't serve all three audiences well.
Design around the decision
Build the agent view around live work: unassigned contacts, aging conversations, active escalations, missing customer context, and suggested knowledge. Keep the manager view focused on queue health, FCR, reopenings, handoff delays, CSAT by issue type, and exceptions to service commitments. The executive view should connect service trends with account importance, renewal timing, product adoption, and revenue signals, without burying the decision in operational detail.
A useful layout puts the outcome first, the likely cause second, and the available action third. If FCR falls for permission-related questions, the manager should be able to drill into example conversations, the articles agents used, transfer destinations, and affected accounts. A red tile without that path only creates anxiety.
By a 2026 projection, customer service is increasingly multichannel, with live chat and messaging representing 45% of inbound interactions, self-service 32%, phone 18%, and email 5%, according to a CX trends summary citing Zendesk. The same source reports that modern AI service agents can resolve 60% to 75% of inbound contacts without escalation, compared with 22% in 2023. Those figures make channel-aware dashboards especially important, because a shift toward messaging or self-service can change the apparent performance of every queue.
Turn alerts into controlled workflows
An alert should contain a reason, an owner, and a next step. For example, a high-priority account with repeated contacts about the same feature might create a customer success task, attach representative conversations to a product feedback record, and ask a support manager to review the knowledge path. A vague “risk detected” notification encourages dismissal.
Use trend views for staffing and product planning, and real-time views for queue intervention. Keep the drill-down available for every alert. That makes it possible to distinguish a real customer risk from a duplicate record, a planned maintenance event, or a temporary channel spike.
A practical customer support insights dashboard should help leaders move from signal to accountable action, not just display more information.
Real World Use Cases and Implementation Examples
A B2B support team can apply analytics in several directions, but the right priority depends on the business problem. Speed optimization suits a queue with preventable delays. Quality optimization suits a queue with fast replies and repeated contacts. Retention optimization suits a business where support friction appears near renewal or expansion decisions.

Consider a SaaS account that contacts support repeatedly about failed integrations. A decisioning workflow can combine contact frequency, unresolved status, account context, product area, and renewal timing. It might notify customer success when the pattern crosses a documented threshold, create a product investigation when the same defect appears across accounts, and reserve an executive alert for cases with strong evidence of commercial risk.
The trigger needs governance. A single frustrated phrase shouldn't label an account as churn risk. A repeated contact without a clear resolution, combined with an open escalation and a relevant commercial milestone, is stronger evidence. Human review should remain available for sensitive decisions, especially when an automated action could affect the customer relationship.
Compare automation quality, not just containment
Ticket deflection means a customer resolves an issue through self-service before a live ticket is created. Common formulas calculate it as self-service resolutions divided by total support-eligible interactions, or contacts deflected divided by deflected plus handled contacts, as defined in this ticket deflection guide. The formula is only the beginning. A useful program also checks whether the customer engaged with the answer and avoided returning with the same problem.
One practical ServiceNow rule counts a deflection only when the user doesn't submit a ticket within 24 hours after interacting with an AI response, and it requires engagement evidence such as a thumbs-up, scrolling, expanding the answer, or spending 15 seconds on it, according to ServiceNow's self-service measurement guidance.
The trade-off is clear in available data. One dataset-style summary reports median AI self-service deflection at 22%, while help centers refreshed within 30 days deflect 45%, compared with 18% for stale centers, as reported by Helply's customer support trends analysis. That comparison suggests better content freshness and governance can outperform merely adding more automation.
This video provides another way to think about analytics-led support operations:
Start with a narrow workflow, such as integration troubleshooting or account-access guidance. Define the allowed action, the evidence required, the escalation trigger, and the quality measure before automation goes live. Then compare automated and human-resolved outcomes by issue type, customer segment, CSAT, repeat contact, and true resolution.
Putting Your Analytics Strategy Into Practice
A workable strategy doesn't begin with an enormous dashboard project. Begin with one customer problem that creates measurable operational pain, then connect the necessary events across support, CRM, product, and revenue systems.
Use this sequence:
- Choose one decision. Decide whether the first project targets repeat contacts, delayed responses, poor knowledge retrieval, escalation risk, or renewal visibility.
- Define the metric. Write down the calculation, channel rules, operating-hours treatment, and reopening logic.
- Audit the source data. Trace several real conversations from creation through resolution and feedback.
- Create the handoff. Specify who receives the alert, what evidence accompanies it, and when automation must stop.
- Review quality. Measure containment alongside true resolution, CSAT, repeat contact, and escalation outcomes.
Integrated platforms are more useful than disconnected point tools when they preserve customer identity and event context across the workflow. Support leaders should be able to move from a signal in the inbox to the account record, relevant product behavior, conversation history, and assigned action without manually reconstructing the story.
Halo AI is one option in this category. It connects support conversations, documentation, call recordings, internal notes, CRM data, and other operational systems, while its analytics capabilities report resolution rates, CSAT, response times, and agent performance in real time. Its Ask AI layer also lets teams query connected operational data in plain English, which can support investigations into churn risk, product adoption, revenue signals, and anomalies.
Keep the first implementation small enough to inspect closely. Improve the definitions, handoff rules, and knowledge content as real interactions reveal false positives. Over time, that disciplined loop turns customer service data analytics from retrospective reporting into a dependable operating system for customer experience and growth.
If your team needs to connect support activity with customer context and actionable handoffs, explore Halo AI to see how its autonomous agents and analytics layer can help resolve routine issues, surface operational signals, and route complex cases with the right context. Start with one workflow, define its quality rules, and use the resulting data to build a smarter support operation.