9 Best Tools for Tracking Customer Service Efficiency Metrics in 2026
Tracking customer service efficiency metrics like first response time, resolution rate, and CSAT is only effective when you have the right tools to capture and act on the data. This guide reviews the 9 best platforms for measuring and improving customer service efficiency in 2026, organized by primary strength so teams can quickly identify the solution that addresses their specific bottleneck.
Customer service efficiency metrics are only as useful as the systems you use to capture, analyze, and act on them. First response time, resolution rate, CSAT, ticket backlog — these numbers tell a story, but most teams are piecing that story together from disconnected dashboards and manual exports.
This list covers the best tools for measuring and improving customer service efficiency in 2026. Whether you need AI-powered automation that learns from every ticket, a purpose-built analytics platform, or a helpdesk with strong reporting built in, there's an option here for your team. We've organized these by primary strength, so you can quickly identify which tool fits your current bottleneck, not just your budget.
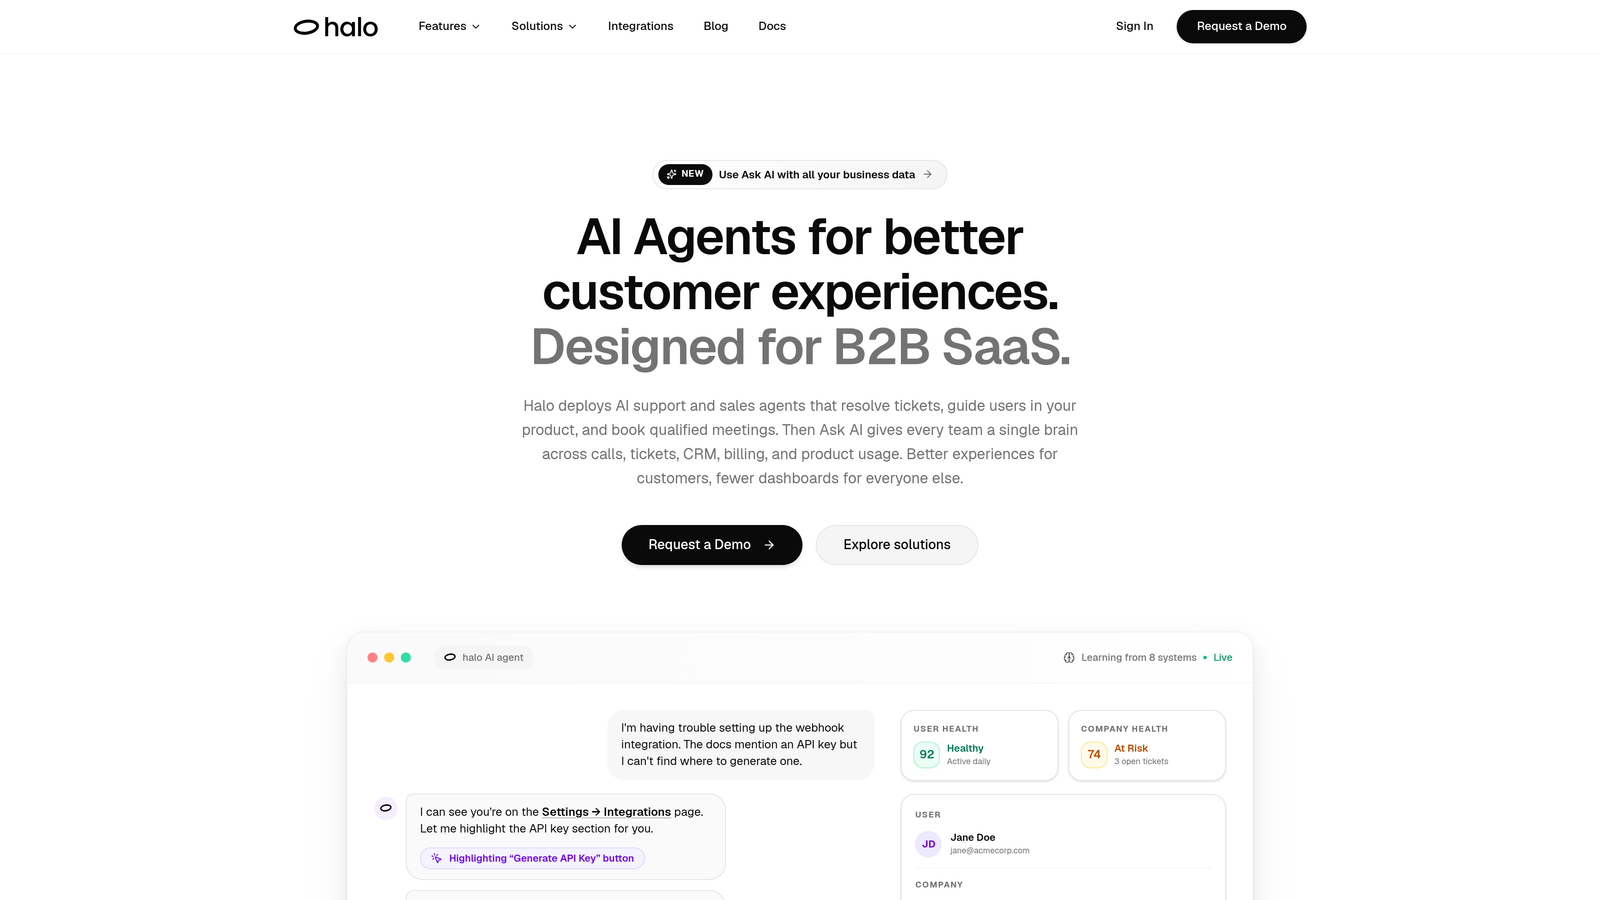
1. Halo AI
Best for: B2B SaaS teams that want efficiency metrics and AI-powered ticket resolution in a single platform
Halo AI is an AI-native customer support platform that resolves tickets autonomously, surfaces business intelligence from support data, and continuously learns from every interaction.
Where This Tool Shines
Most tools on this list tell you your first response time is too high. Halo AI is simultaneously working to bring it down. That's the core distinction: Halo isn't primarily a reporting tool, it's an operational AI platform that also surfaces intelligence. The Smart Inbox goes beyond standard KPIs to surface customer health signals, revenue anomalies, and bug pattern detection — the kind of context that turns a support metric into a business signal.
The page-aware chat widget is particularly worth noting. Because the AI understands what a user is actually looking at when they submit a ticket, resolution accuracy improves and efficiency data becomes more meaningful. You're not just measuring how fast tickets close; you're measuring how well the system understands the problem in the first place.
Key Features
Smart Inbox with Business Intelligence: Surfaces customer health signals, revenue anomalies, and bug pattern detection alongside standard support KPIs like FRT and CSAT.
Page-Aware Chat Widget: The AI sees what users see, providing context that improves resolution accuracy and makes efficiency data more actionable.
Auto Bug Ticket Creation: Connects support volume to engineering workflow in Linear automatically, so recurring issues don't stay invisible in your backlog.
Live Agent Handoff: Full context is preserved during escalation, so your escalation metrics reflect real complexity rather than tool failure.
Cross-System Integrations: Connects with Linear, Slack, HubSpot, Intercom, Stripe, Zoom, PandaDoc, and Fathom for cross-system intelligence across your entire business stack.
Best For
B2B SaaS companies scaling support operations who want efficiency metrics embedded in an operational layer that acts on the data — not just reports it. Particularly strong for product-led teams where support data and product usage data need to be connected.
Pricing
Contact for pricing. Designed for B2B SaaS teams scaling support operations rather than individual agent seat purchases.
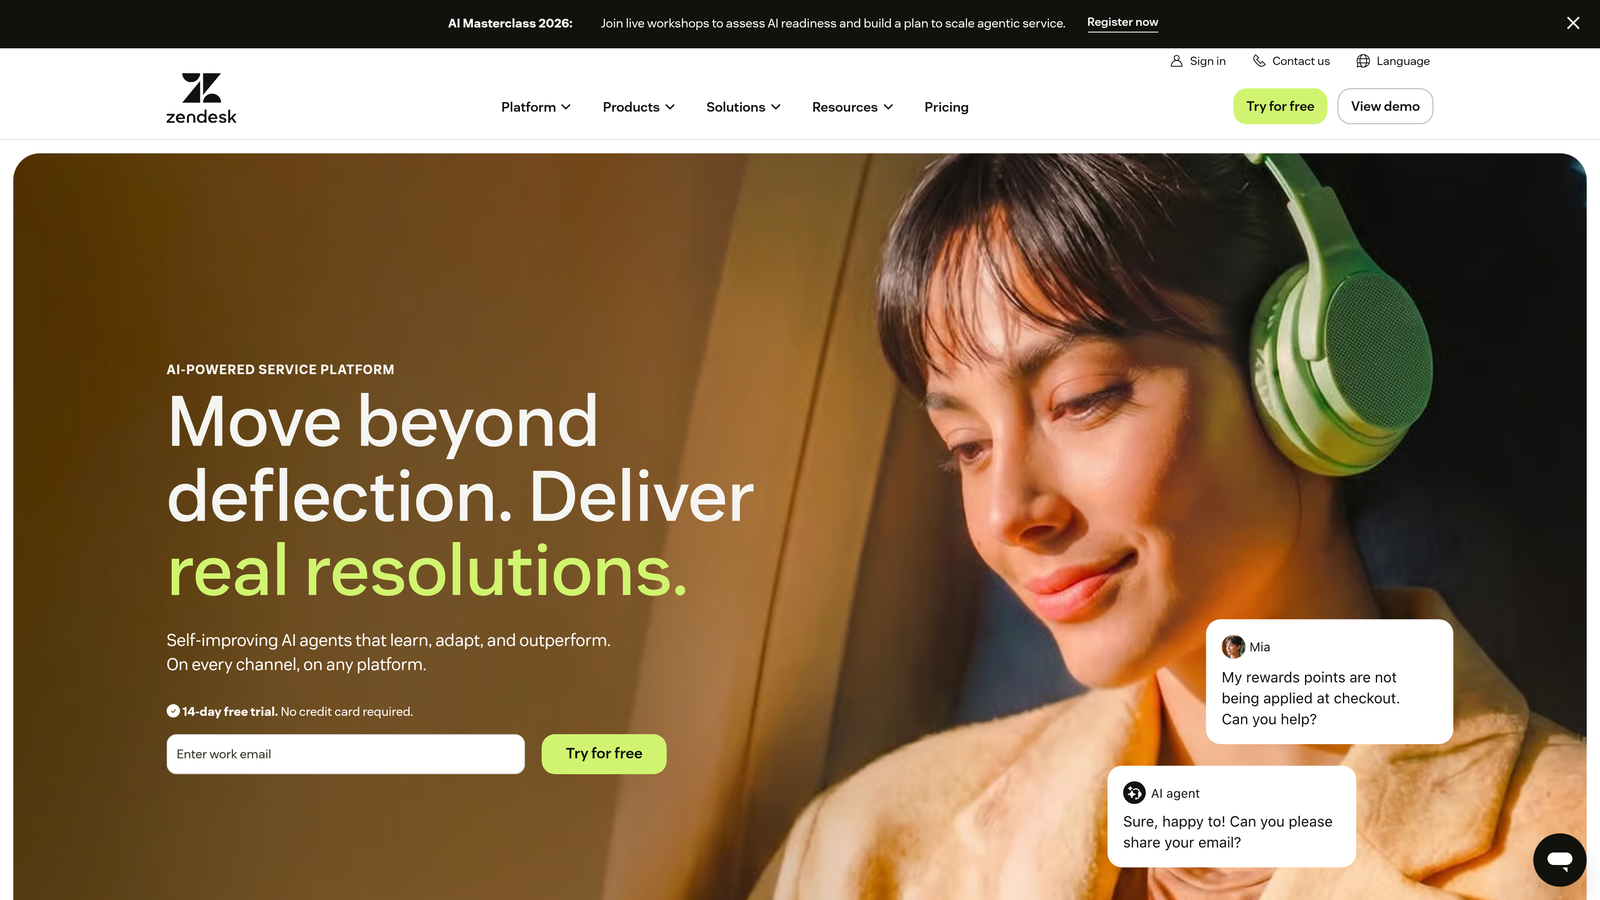
2. Zendesk
Best for: High-volume support teams needing comprehensive, multi-channel efficiency reporting
Zendesk is the industry-standard helpdesk platform with a dedicated analytics module that provides deep coverage of every core customer service efficiency metric.
Where This Tool Shines
Zendesk Explore is one of the most complete native analytics experiences in the helpdesk space. Pre-built dashboards cover FRT, AHT, FCR, CSAT, and ticket backlog without any configuration, and the custom report builder lets experienced ops teams go significantly deeper. If your team handles high ticket volume across email, chat, voice, and social, Zendesk's unified reporting view is genuinely hard to beat.
The SLA compliance monitoring with automated alerts is a standout for teams with formal service agreements. You're not discovering breaches after the fact — you're getting notified in time to act. The large integration marketplace also means you can extend reporting into adjacent tools without building custom pipelines.
Key Features
Zendesk Explore: Pre-built and custom dashboards covering FRT, AHT, FCR, CSAT, and ticket backlog with no setup required on higher tiers.
Multi-Channel Reporting: Unified view across email, chat, voice, and social — all in one reporting interface.
Agent Performance Tracking: Individual and team-level breakdowns with workload and efficiency metrics side by side.
SLA Compliance Monitoring: Automated alerts for SLA breaches before they happen, not after.
Third-Party Integration Marketplace: Hundreds of integrations for extending analytics into adjacent tools and workflows.
Best For
Mid-market and enterprise support teams with high ticket volume across multiple channels who need comprehensive native reporting without building a separate BI layer. Less ideal for small teams where the cost-to-value ratio can be harder to justify.
Pricing
Starts at approximately $55 per agent per month (Suite Team); Zendesk Explore is included on higher-tier plans. Pricing scales with agent count and can become significant at enterprise scale.
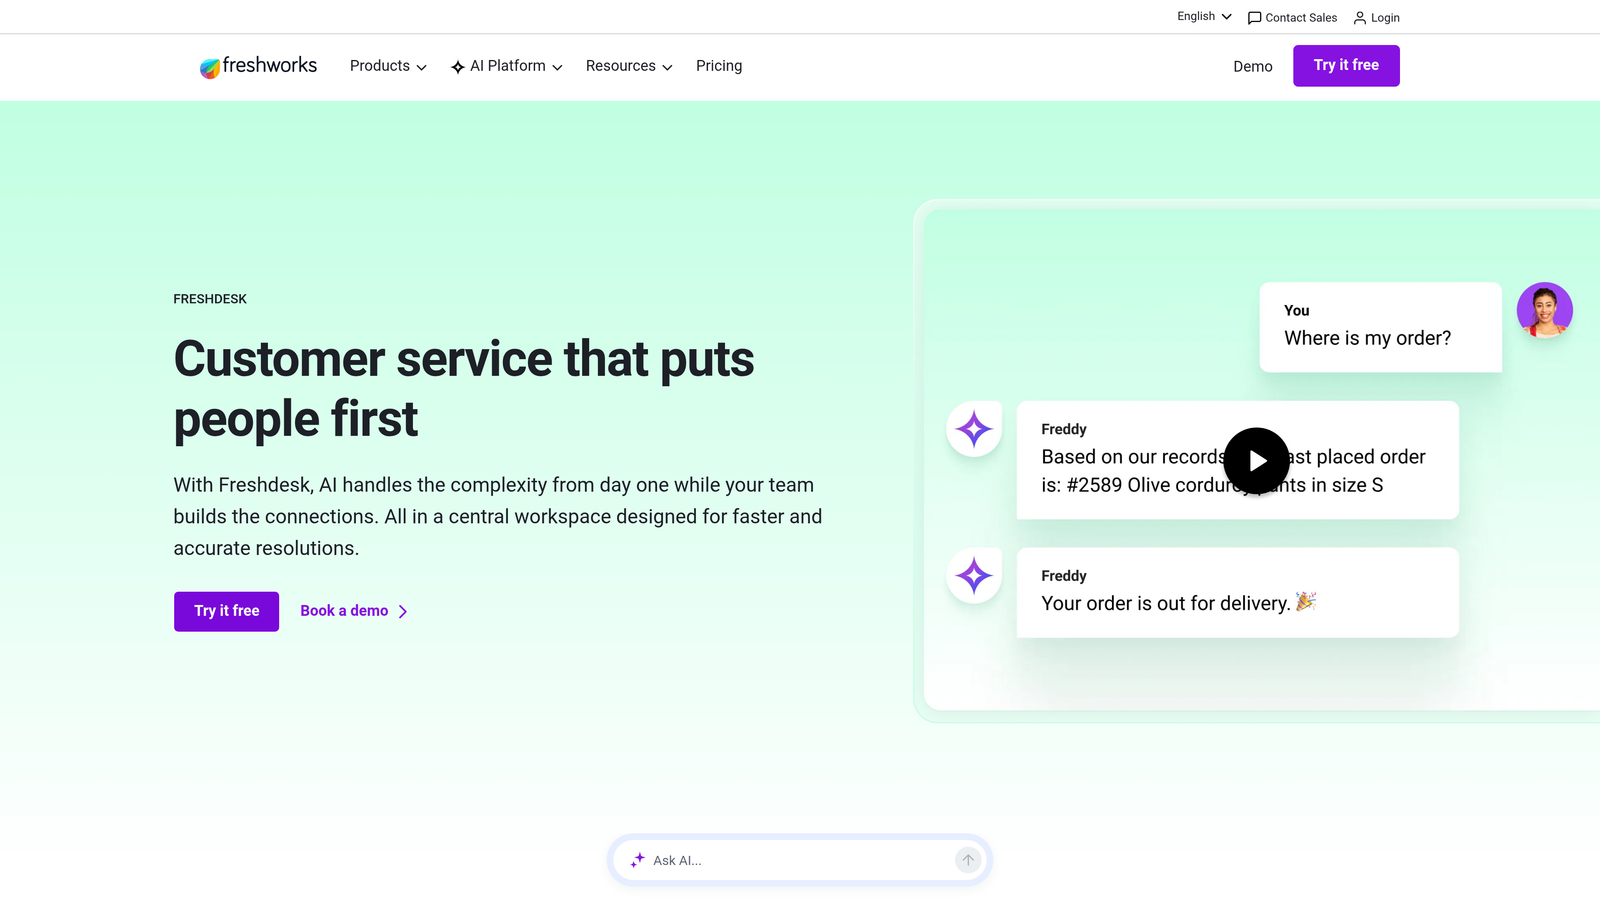
3. Freshdesk
Best for: SMB and mid-market teams wanting strong built-in analytics at a more accessible price point
Freshdesk is a full-featured helpdesk with competitive built-in analytics and an AI layer that surfaces actionable insights from support data without requiring a separate BI tool.
Where This Tool Shines
Freshdesk Analytics, powered by the Freshworks Neo platform, covers the core efficiency metrics most support teams need: ticket trends, agent performance, and customer satisfaction reporting. The interface is approachable enough that team leads can build their own reports without involving a data analyst. For teams coming from spreadsheet-based reporting, this is a meaningful upgrade with a manageable learning curve.
Freddy AI, Freshdesk's AI layer, adds something genuinely useful: it surfaces patterns and recommendations from support data automatically. Rather than waiting for a manager to notice that a certain ticket category is spiking, Freddy flags it. That kind of proactive insight puts Freshdesk ahead of pure-reporting tools in the same price range.
Key Features
Freshdesk Analytics (Neo Platform): Ticket trends, agent performance, and customer satisfaction reporting in a customizable dashboard interface.
Freddy AI Insights: Automatically surfaces patterns and recommendations from support data without requiring manual analysis.
CSAT Surveys: Response tracking and trend analysis built into the core product, not an add-on.
SLA Monitoring and Breach Alerts: Real-time SLA tracking with automated notifications for at-risk tickets.
Custom Report Builder: Available on higher-tier plans for teams with more specific metric requirements.
Best For
SMBs and growing mid-market teams that want strong native analytics without the cost of enterprise platforms. Also a good fit for teams already using other Freshworks products who want a unified reporting experience across the suite.
Pricing
Free plan available; paid plans start at approximately $15 per agent per month. Advanced analytics features are available on higher-tier plans.
4. Intercom
Best for: SaaS teams that want support efficiency metrics in the context of the broader customer lifecycle
Intercom is a customer communications platform that combines support efficiency metrics with product usage and customer lifecycle data — particularly powerful when support KPIs need to be understood alongside what customers are actually doing in your product.
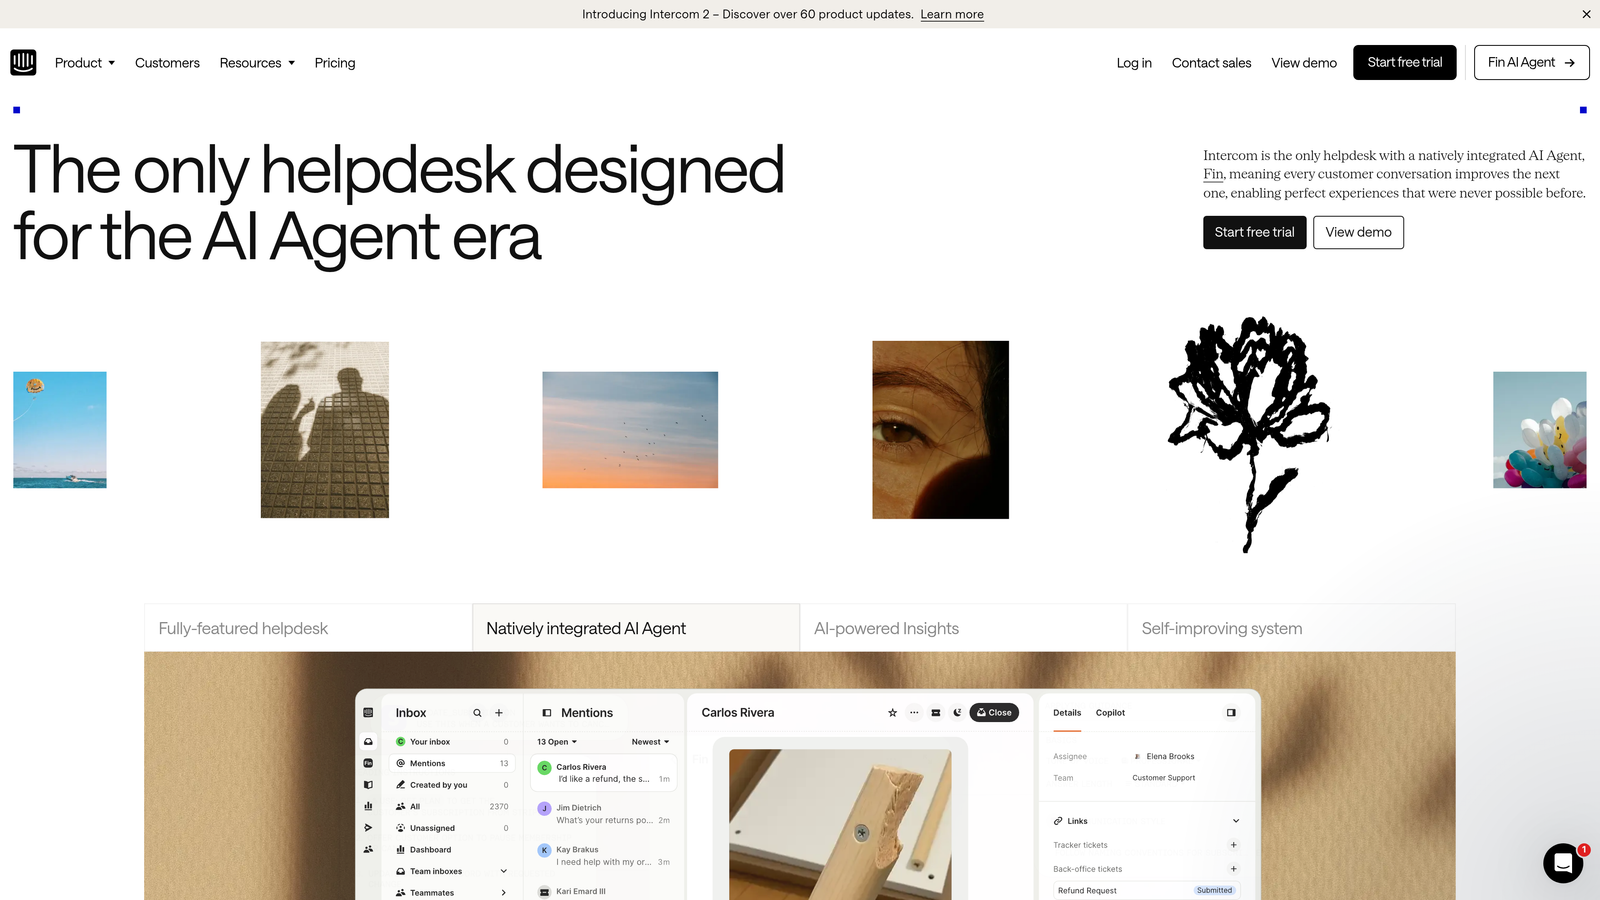
Where This Tool Shines
Intercom's conversation-level analytics are unusually granular. Response time, resolution rate, and CSAT are tracked at the individual conversation level, which makes it easier to identify patterns at a segment or cohort level rather than just in aggregate. For SaaS teams, the ability to cross-reference support metrics with product usage and subscription data is a meaningful differentiator — you can see that churning customers also had longer resolution times, for example.
The Fin AI agent deflection metrics deserve specific mention. Knowing what percentage of queries are resolved without human involvement — and which categories are being deflected successfully — is a useful efficiency signal that most traditional helpdesks don't surface clearly. It reframes efficiency as a question of automation coverage, not just agent speed.
Key Features
Conversation-Level Analytics: Response time, resolution rate, and CSAT tracked at the individual conversation level for granular segmentation.
Fin AI Deflection Metrics: Clear visibility into what percentage of queries are resolved by AI without human involvement.
Customer Data Platform Integration: Cross-reference support metrics with product usage and subscription data for lifecycle context.
Team Performance Reports: Workload distribution and capacity insights for support managers planning staffing.
Real-Time Queue Reporting: Live visibility into active conversations and queue status for intraday management.
Best For
SaaS product teams and customer success organizations where support metrics need to be understood in the context of product adoption, trial conversion, or churn risk. Less suitable for teams that only need basic helpdesk reporting.
Pricing
Starts at approximately $39 per seat per month; Fin AI usage-based pricing is charged on top of the base plan, so total cost scales with conversation volume.
5. Klipfolio
Best for: Ops-minded support managers who want a single, customizable view across multiple tools
Klipfolio is a dedicated KPI dashboard platform that connects to most major helpdesks, CRMs, and data sources — giving teams a consolidated view of support efficiency metrics without rebuilding their entire tech stack.
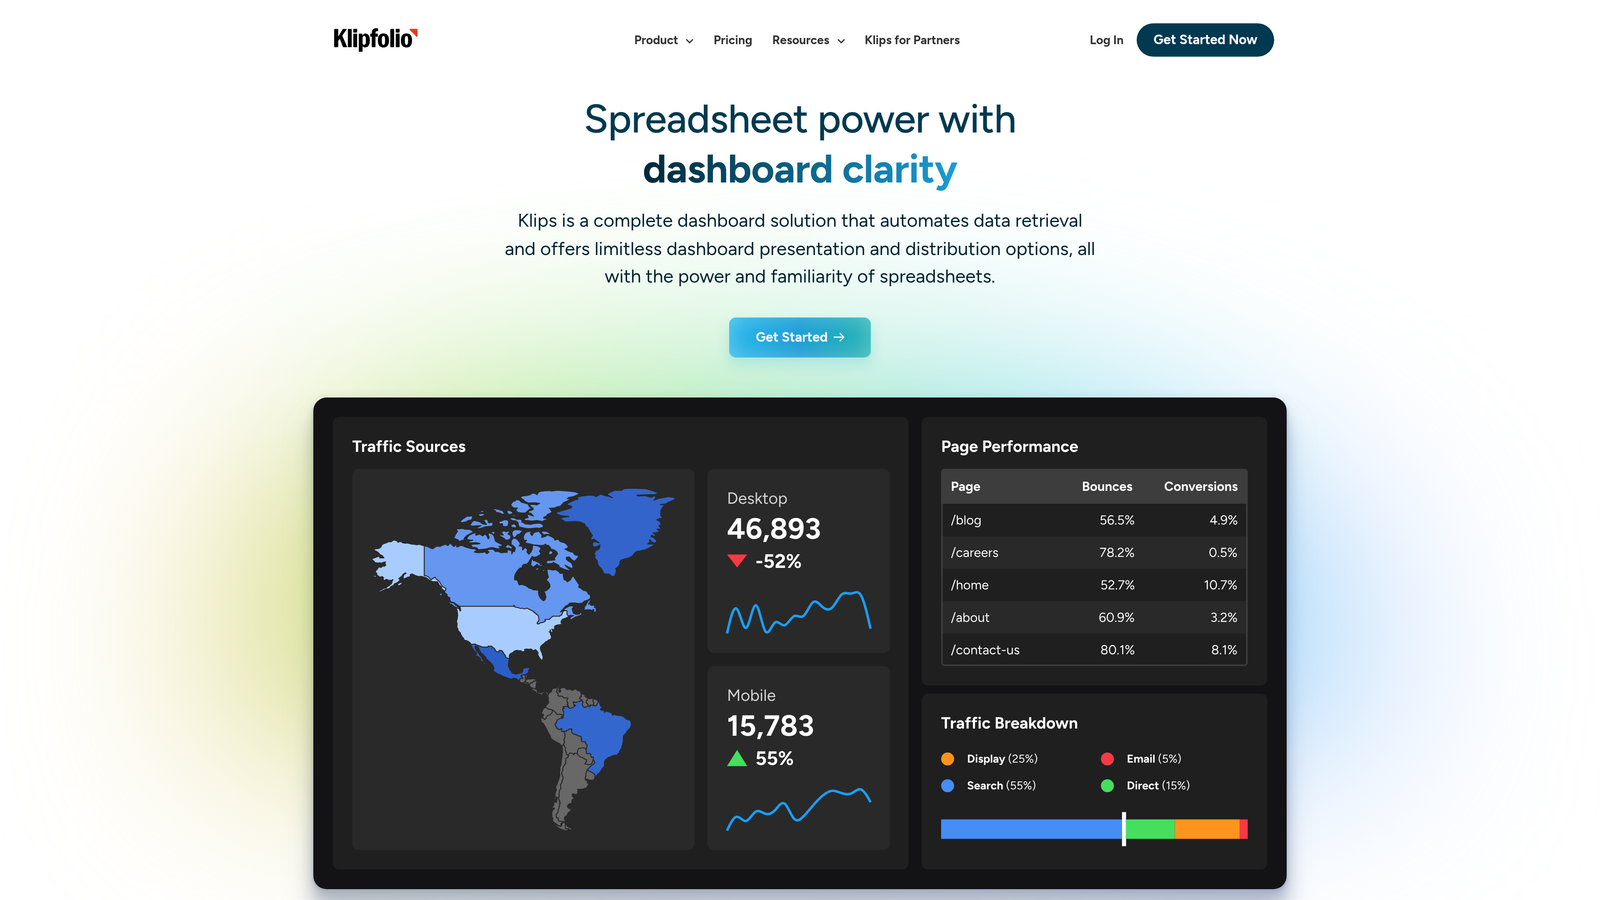
Where This Tool Shines
The core value here is flexibility without complexity. Klipfolio connects to Zendesk, Freshdesk, Salesforce, Google Sheets, and dozens of other sources, and lets you build custom metric dashboards without requiring SQL or data engineering resources. For support ops managers who are frustrated by the limitations of native helpdesk reporting but don't have a dedicated BI team, this is a practical middle ground.
The PowerMetrics module adds more advanced metric modeling and goal tracking for teams that want to go beyond surface-level dashboards. Shareable dashboards also make it easy to keep stakeholders across the business aligned on support performance without giving everyone access to the underlying helpdesk.
Key Features
Pre-Built Connectors: Native integrations with Zendesk, Freshdesk, Salesforce, Google Sheets, and dozens of additional sources.
No-Code Dashboard Builder: Fully customizable metric dashboards without requiring SQL or data engineering involvement.
PowerMetrics Module: Advanced metric modeling and goal tracking for more sophisticated reporting needs.
Shareable Dashboards: Easy stakeholder reporting across teams without requiring helpdesk access.
Flexible Data Refresh: Scheduled or real-time data refresh options depending on your data source and plan.
Best For
Support operations managers at companies using multiple tools who need a consolidated view of efficiency metrics. Also useful for teams that have outgrown native helpdesk reporting but aren't ready to invest in a full enterprise BI platform.
Pricing
Starts at approximately $125 per month for small teams; pricing scales with the number of data sources and users.
6. Geckoboard
Best for: Teams that want live support metrics visible to everyone, without any technical setup
Geckoboard is a real-time KPI dashboard tool built for team transparency — designed to display live support metrics on office screens or shared team views with minimal configuration.
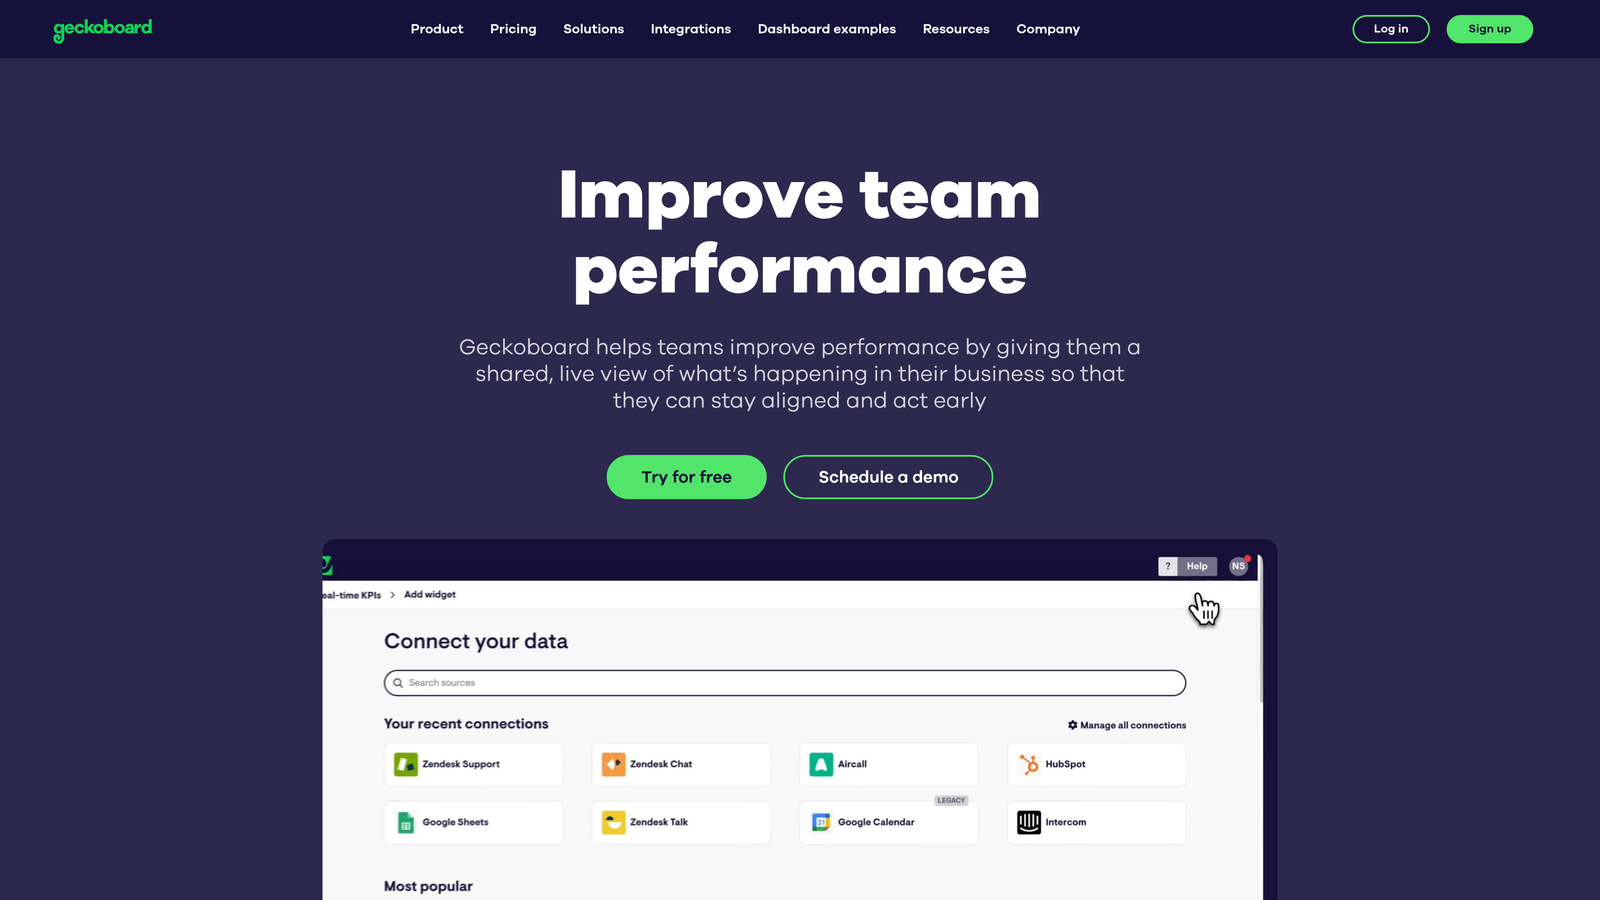
Where This Tool Shines
Geckoboard's value proposition is simplicity and ambient visibility rather than deep analytical capability. The drag-and-drop dashboard builder requires no SQL or coding, and the TV mode makes it easy to display live KPIs on an office screen or a pinned browser tab for remote teams. When everyone on the support floor can see the current FRT and queue depth in real time, behavior changes without anyone having to pull a report.
For distributed teams, shareable dashboard links create async metric visibility without requiring everyone to log into the helpdesk. It's a lightweight solution that solves a specific problem well: making metrics ambient rather than buried in a reporting tab that no one checks.
Key Features
Native Helpdesk Integrations: Live data pulls from Zendesk, Intercom, Freshdesk, and Salesforce without any custom development.
Drag-and-Drop Dashboard Builder: No SQL or coding required — set up a live dashboard in minutes.
TV Mode: Display live KPIs on office screens or remote team dashboards for ambient metric visibility.
Goal Tracking: Visual indicators for targets like FRT thresholds and CSAT benchmarks, with clear pass/fail status.
Shareable Links: Async metric visibility for distributed teams without requiring helpdesk access.
Best For
Support teams that want metrics to be visible and ambient rather than siloed in a reporting interface. Particularly useful for team leads managing intraday performance and for organizations with office screens or remote team dashboards.
Pricing
Starts at approximately $49 per month; pricing scales with the number of dashboards and data sources.
7. Datadog
Best for: Technical support teams and engineering-led orgs correlating ticket volume with system events
Datadog is an infrastructure and application monitoring platform increasingly used by technical support teams to connect support efficiency metrics with deployment events, error rates, and system performance.
Where This Tool Shines
Datadog solves a problem that traditional helpdesks can't: understanding why ticket volume is spiking. When a deployment introduces a bug or an infrastructure event causes errors, Datadog can surface that connection before your support team is overwhelmed. For engineering-led support organizations, this kind of correlation between system health and support load is invaluable for prioritizing engineering work and anticipating support demand.
The anomaly detection and alerting capabilities are particularly relevant here. Rather than discovering a ticket surge after it's already affecting CSAT, you can configure alerts that fire when support volume deviates from expected patterns — giving you time to route additional agents or communicate proactively with affected customers.
Key Features
System-to-Support Correlation: Connect ticket volume spikes to deployment events, error rates, and infrastructure incidents.
Custom Dashboards: Combine support data (via API) with system performance metrics in a single view.
Anomaly Detection and Alerting: Surface product-driven ticket surges before they escalate into CSAT problems.
Log Management: Trace specific error patterns that are driving support volume to the engineering team.
Integration Ecosystem: Connects with Zendesk, PagerDuty, Slack, and other tools in the support and engineering stack.
Best For
Engineering-led support organizations and technical support teams at SaaS companies where product issues are a significant driver of ticket volume. Not a helpdesk replacement — it's a layer that adds system context to your existing support metrics.
Pricing
Usage-based pricing with a free tier available; infrastructure monitoring starts at approximately $15 per host per month. Total cost depends heavily on the data volume and features used.
8. Tableau
Best for: Large organizations needing cross-functional analysis that connects support data to revenue and product metrics
Tableau is Salesforce's enterprise BI platform — capable of ingesting support data from any source and joining it with sales, product, and financial data for analysis at a scale that purpose-built helpdesk tools can't match.
Where This Tool Shines
Tableau's power is in its flexibility. You can connect support data from Zendesk, Salesforce, databases, and spreadsheets into a single unified view, then join it with revenue data, product usage data, or anything else that matters to your business. For large organizations where support efficiency needs to be understood in the context of customer lifetime value or churn risk, that kind of cross-functional analysis is difficult to replicate in a native helpdesk tool.
The advanced visualization options — trend analysis, cohort comparison, efficiency benchmarking — go well beyond what most helpdesks offer natively. Calculated fields and LOD expressions allow custom metric definitions that can match your organization's specific definitions of efficiency, rather than forcing you to use the platform's defaults.
Key Features
Universal Data Connectivity: Connect support data from any source — Zendesk, Salesforce, databases, spreadsheets — into unified views.
Advanced Visualization: Trend analysis, cohort comparison, and efficiency benchmarking with sophisticated charting options.
Custom Metric Definitions: Calculated fields and LOD expressions for metrics that go beyond standard helpdesk KPIs.
Embedded Analytics: Share insights across business functions without requiring everyone to have a Tableau license.
Salesforce Integration: Native connection to Salesforce data for linking support efficiency to revenue and customer success metrics.
Best For
Large enterprises with dedicated analytics resources and complex, cross-functional reporting needs. Overkill for most SMBs and mid-market teams — the setup investment and licensing cost are only justified at significant scale or organizational complexity.
Pricing
Tableau Creator licenses start at approximately $75 per user per month; Viewer licenses are available at a lower cost for stakeholders who only need to consume reports.
9. Help Scout
Best for: Small teams that need clean, reliable reporting without complexity or steep learning curves
Help Scout is a lightweight helpdesk with clean built-in reporting that covers the core efficiency metrics most small teams need, without the overhead of enterprise platforms.
Where This Tool Shines
Help Scout's reporting philosophy is refreshingly straightforward: give teams the metrics they actually use, in a format they can understand immediately, without requiring configuration. Happiness Scores (their CSAT equivalent) are collected automatically after conversations. Response time and resolution time tracking are available on all paid plans. There's no separate analytics module to set up, no SQL to write, and no dashboards to configure before you can see meaningful data.
For small support teams that are spending more time wrestling with their helpdesk than actually helping customers, Help Scout's simplicity is a genuine feature. The volume trends and busiest period analysis are particularly useful for staffing decisions — a common pain point for lean teams that can't afford to overstaff but also can't afford to miss SLAs during peak periods.
Key Features
Happiness Scores: Automatic CSAT collection after conversations — no survey setup required.
Response and Resolution Time Tracking: Team and individual agent-level data available on all paid plans.
Volume Trends and Peak Period Analysis: Busiest period identification for staffing and scheduling decisions.
Team Performance Reports: Workload distribution insights for managers without requiring a separate analytics tool.
No-Setup Reporting: Available immediately on all paid plans without configuration or add-ons.
Best For
Small support teams and startups that need reliable core metrics without the complexity, cost, or learning curve of enterprise helpdesk platforms. If your team has fewer than 10 agents and your reporting needs are straightforward, Help Scout is likely more than sufficient.
Pricing
Starts at approximately $22 per user per month (Standard plan); reporting is included on all paid plans with no additional cost.
Which Tool Is Right for Your Team
The right tool depends less on which metrics you want to track and more on what you want to do with them. Here's a quick way to think through the decision.
If you want metrics and AI-powered resolution in one platform: Halo AI is the only tool on this list that both measures efficiency and actively works to improve it. The Smart Inbox surfaces business intelligence beyond standard KPIs, and the continuous learning architecture means your efficiency metrics should trend in the right direction over time without manual tuning.
If you need comprehensive multi-channel helpdesk reporting: Zendesk Explore is the most complete native analytics experience available, particularly for high-volume teams across email, chat, voice, and social.
If you're a growing SMB watching your budget: Freshdesk offers strong analytics and Freddy AI insights at a price point that's significantly more accessible than enterprise alternatives.
If your support metrics need product context: Intercom's ability to cross-reference support data with product usage and subscription data makes it the strongest choice for SaaS teams managing the full customer lifecycle.
If you need a consolidated view across multiple tools: Klipfolio gives ops-minded managers a flexible dashboard layer without requiring a data engineering team.
If ambient visibility is the priority: Geckoboard is purpose-built for making metrics visible to everyone in real time, with minimal setup.
If ticket volume correlates with system events: Datadog is the right layer for engineering-led organizations that need to connect support load with infrastructure and deployment data.
If you're a large enterprise with cross-functional BI needs: Tableau has the depth and flexibility to join support data with revenue, product, and financial data at scale.
If you're a small team that just needs clean, reliable reporting: Help Scout delivers what you need without the overhead.
Tracking metrics is only half the equation. Acting on them automatically is where real efficiency gains happen. Your support team shouldn't scale linearly with your customer base — AI agents can handle routine tickets, guide users through your product, and surface business intelligence while your team focuses on complex issues that need a human touch. See Halo in action and discover how continuous learning transforms every interaction into smarter, faster support.