8 Best Support Anomaly Detection Tools in 2026
Support anomaly detection tools monitor customer support data in real time, flagging unusual patterns — like overnight ticket spikes or sudden CSAT drops — before they escalate into churn or operational crises. This guide evaluates the 8 best options in 2026 based on detection speed, integration depth, alert actionability, and signal-to-noise quality.
 Grant CooperFounder13 min read
When your ticket volume spikes overnight or your CSAT drops without warning, the damage is often already done. Customers have churned, engineers are scrambling, and your support team is playing catch-up instead of getting ahead of the problem. Support anomaly detection tools change that equation by monitoring your customer support data in real time, flagging unusual patterns before they escalate into something bigger.
The best tools in this space go beyond simple threshold alerts. They surface root causes, connect support signals to product and revenue data, and give teams the context they need to act fast. Whether you're dealing with a sudden ticket surge after a bad deploy, a CSAT dip tied to a specific feature, or a quiet churn signal buried in your inbox, the right tool makes it visible before it becomes a crisis.
Here are the top support anomaly detection tools worth evaluating in 2026, selected based on real-time detection capabilities, integration depth with common support stacks, actionability of alerts, and overall signal-to-noise quality.
1. Halo AI
Best for: B2B SaaS teams that want anomaly detection embedded directly in their support workflow
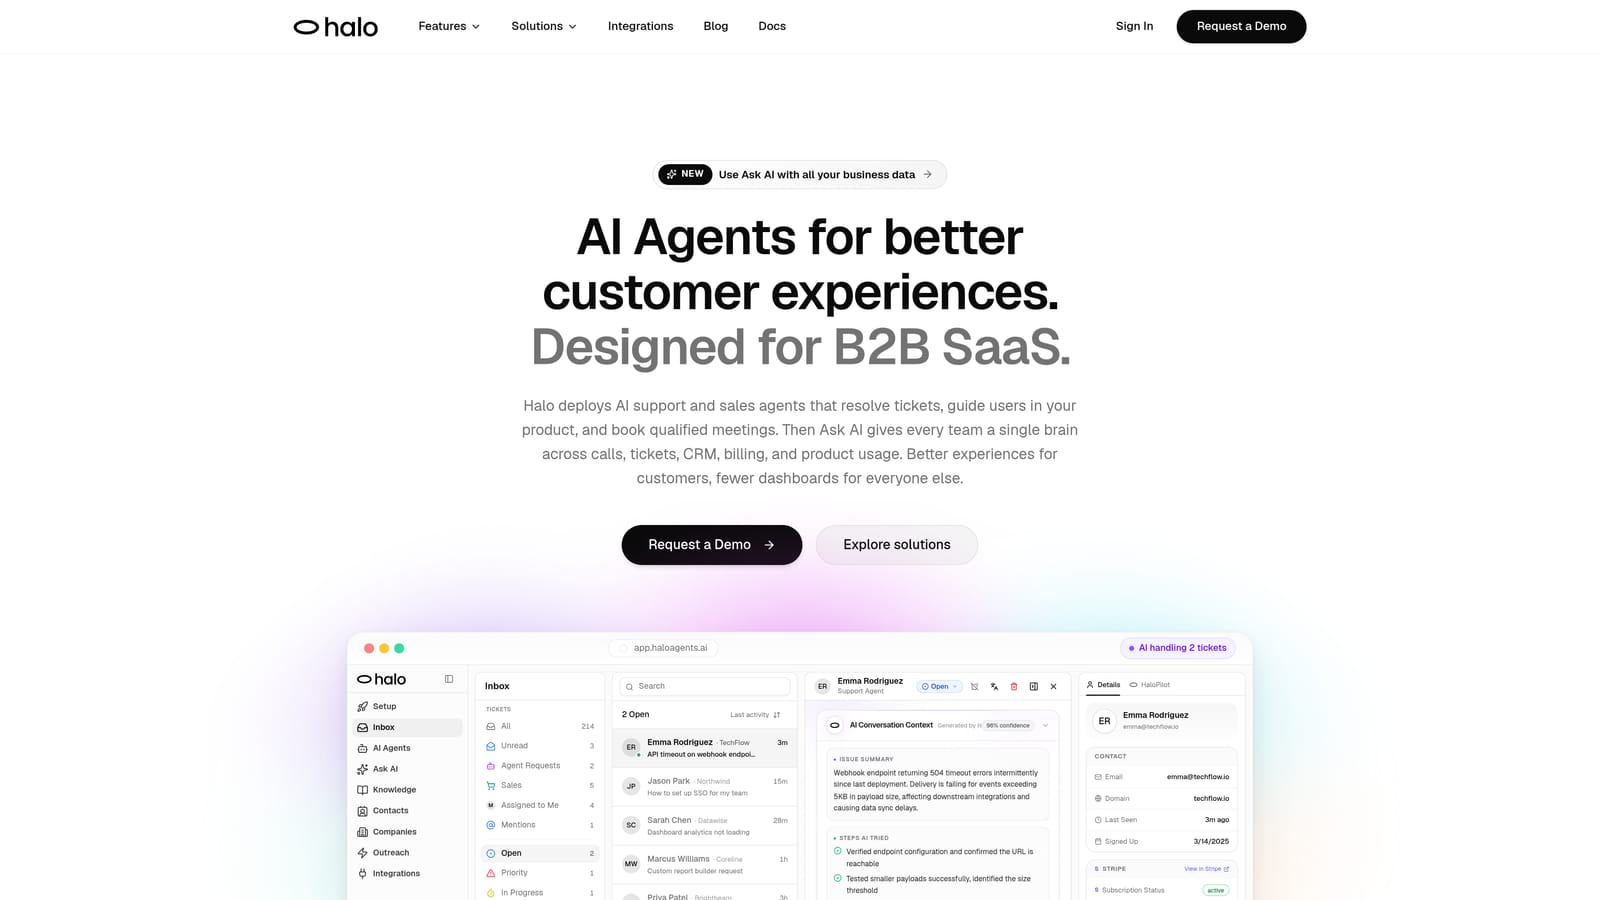
Halo AI is an AI-native customer support platform with a smart inbox that surfaces anomalies, customer health signals, and revenue intelligence without requiring a separate BI tool.
Where This Tool Shines
Most anomaly detection setups require you to build a separate monitoring layer and then check it manually. Halo takes a different approach: the intelligence is embedded in the support workflow itself. When something unusual happens in your ticket data, the smart inbox surfaces it in the same place your team is already working.
What makes this particularly powerful is the cross-stack signal correlation. Halo connects to Linear, Slack, HubSpot, Intercom, Stripe, Zoom, PandaDoc, and Fathom, so an anomaly isn't just flagged in isolation. It's contextualized against revenue data, product usage, and engineering activity. The continuous learning architecture also means detection improves over time as the system builds a baseline specific to your environment.
Key Features
Smart Inbox with Anomaly Detection: Business intelligence analytics, customer health signals, and revenue intelligence are baked directly into the inbox, not bolted on as a separate dashboard.
Auto Bug Ticket Creation: When anomalies suggest a product issue, Halo automatically creates bug tickets in Linear, closing the loop between support signals and engineering response.
Page-Aware AI Agents: Agents can see what users see in real time, adding crucial context to anomaly root cause analysis when users report problems on specific pages or flows.
Cross-Stack Signal Correlation: Deep integrations with Stripe, HubSpot, and Intercom allow support anomalies to be correlated with revenue events and customer lifecycle data.
Continuous Learning: The platform improves its detection baseline from every interaction, reducing false positives over time without manual tuning.
Best For
B2B SaaS companies and product teams that want anomaly detection as part of their support infrastructure, not as an add-on. Particularly well-suited for teams using Intercom, HubSpot, or Slack who want support intelligence without building a separate analytics stack.
Pricing
Contact for pricing. A demo is available at haloagents.ai.
2. Datadog
Best for: Engineering and DevOps teams that want to correlate support anomalies with infrastructure events
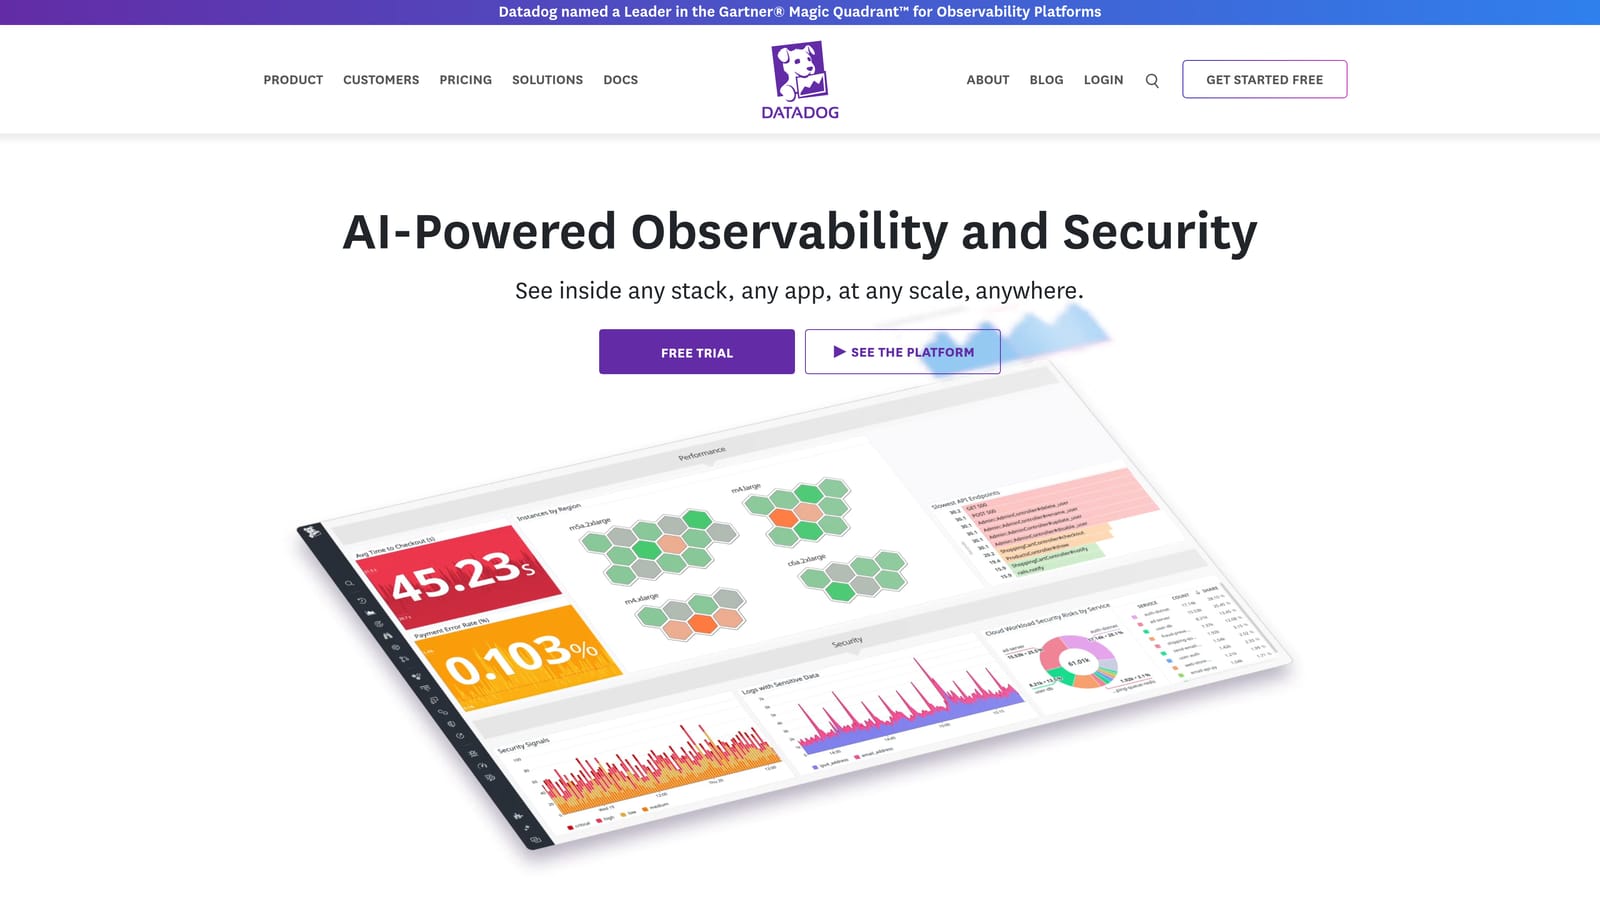
Datadog is a leading infrastructure and application monitoring platform that can correlate support ticket anomalies with system-level events like deploys, errors, and latency spikes.
Where This Tool Shines
Datadog's core strength is cross-layer observability. When a ticket spike happens, Datadog can tell you whether a recent deploy, a database slowdown, or an API error rate change preceded it. That kind of correlation is difficult to achieve with helpdesk-native analytics tools, which typically can't see infrastructure signals.
Support data can be ingested via API, allowing teams to build custom monitors that treat ticket volume as just another metric alongside CPU usage, error rates, and latency. The machine learning-based anomaly detection adapts to seasonal patterns, so you're not getting alerted every Monday morning when volume naturally rises.
Key Features
Cross-Signal Anomaly Detection: Monitors logs, metrics, APM traces, and custom data sources in a single platform, enabling genuine root cause correlation.
ML-Based Detection: Configurable sensitivity with machine learning baselines that adapt to your traffic patterns over time.
Support Data Ingestion: Custom metrics and log pipelines allow ticket data from Zendesk or Salesforce to be ingested and monitored alongside infrastructure signals.
Incident Management: Built-in alerting and incident workflows mean anomalies can trigger coordinated response across engineering and support teams.
Integration Ecosystem: Native integrations with Zendesk, Salesforce, PagerDuty, and hundreds of other tools.
Best For
Teams with engineering or DevOps involvement in support operations, particularly those who want to understand whether support anomalies are caused by product or infrastructure issues. Less suited for support teams without technical resources to configure custom pipelines.
Pricing
Usage-based pricing with a free tier available. Pro plans start at approximately $15 per host per month, with costs scaling based on data volume and features used.
3. Intercom
Best for: Teams already using Intercom as their primary support channel who want built-in trend monitoring
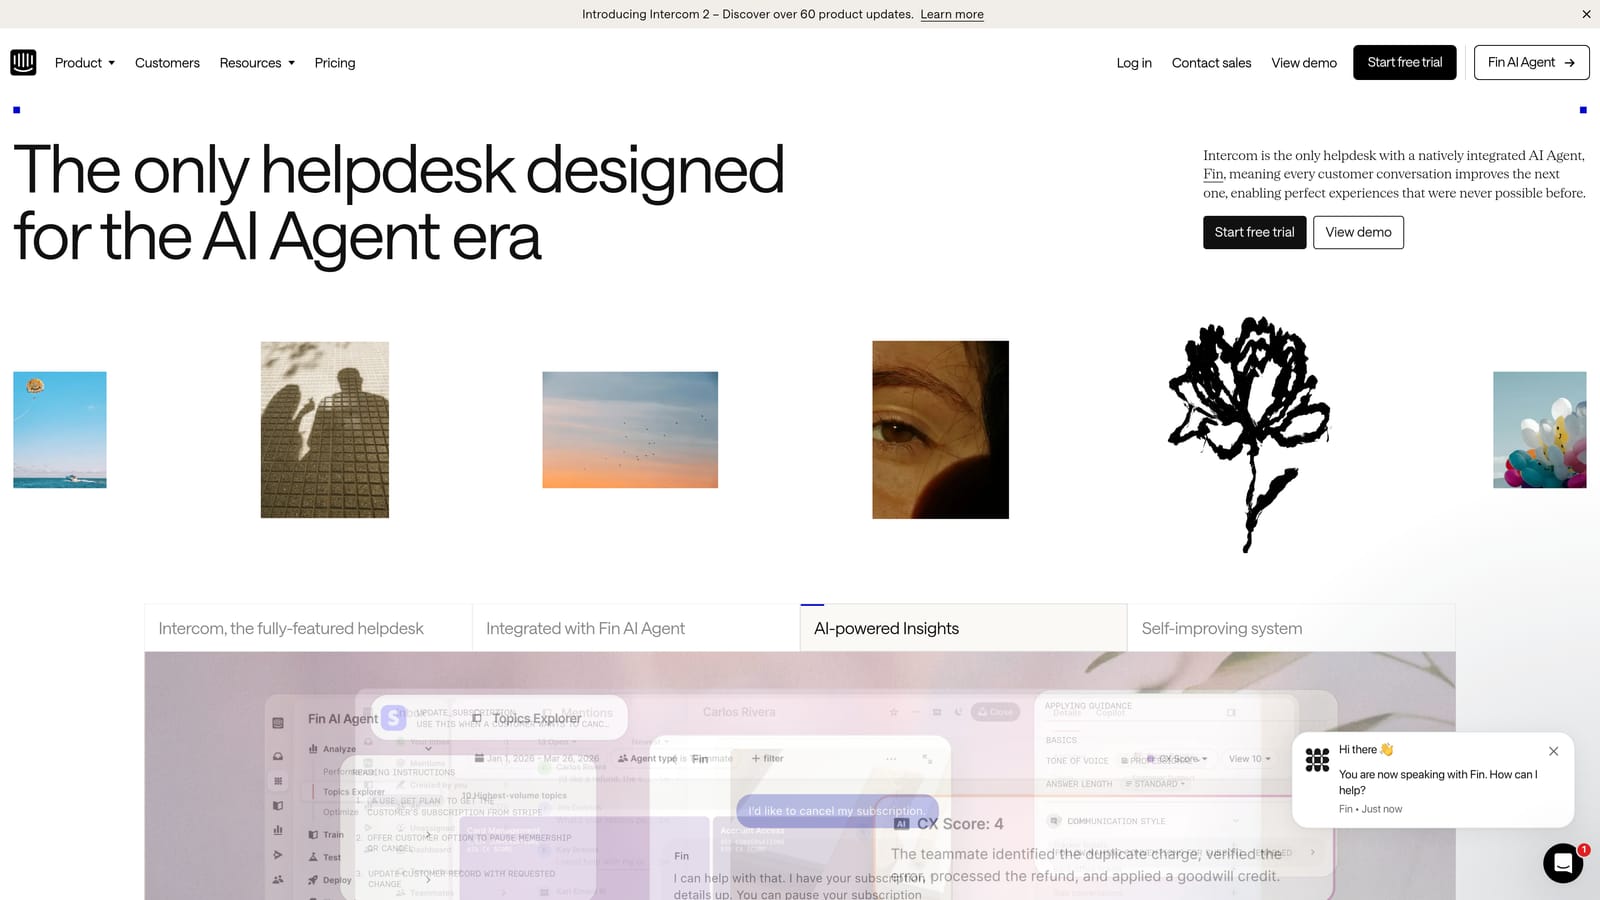
Intercom is a customer messaging platform with native conversation analytics and trend monitoring, useful for teams that don't want to bolt on a separate analytics tool.
Where This Tool Shines
If your team lives in Intercom, the reporting layer is already there. Conversation volume trends, CSAT tracking, and topic clustering give support managers a reasonable view of what's normal versus unusual without leaving the platform. The AI-powered conversation summaries also help surface pattern changes that might not be visible in raw volume numbers.
Fin, Intercom's AI agent, feeds its resolution data back into reporting, which means you can detect anomalies in automated resolution rates as well as human-handled conversations. A sudden drop in Fin's resolution rate, for example, can be an early signal of a new type of issue the AI hasn't been trained to handle.
Key Features
Conversation Volume Trending: Built-in reporting on inbound volume by channel, topic, and time period with trend visibility.
CSAT Tracking: Native CSAT collection and trend analysis, with the ability to identify drops over configurable time windows.
AI Conversation Summaries: Automated summaries that highlight unusual patterns across large conversation volumes.
Custom Report Builder: Threshold-based alerting and custom dashboards for teams with specific monitoring requirements.
Fin AI Reporting: Automated resolution rate data feeds into analytics, enabling anomaly detection across AI-handled conversations.
Best For
Support teams already operating on Intercom who want basic anomaly awareness without adding tools to their stack. Teams needing deep statistical anomaly detection or cross-system correlation will likely need to supplement Intercom's reporting with a dedicated tool.
Pricing
Starts at approximately $39 per seat per month. Advanced analytics features are available on higher-tier plans.
4. Zendesk Explore
Best for: Zendesk-native teams wanting customizable dashboards and threshold-based alerting
Zendesk Explore is Zendesk's native analytics and reporting product, offering customizable dashboards and alert triggers for ticket volume, CSAT, and SLA performance.
Where This Tool Shines
For teams running on Zendesk, Explore removes the need to export data to a third-party analytics tool. Pre-built dashboards cover the most common support metrics out of the box, and the custom report builder gives operations teams enough flexibility to track the specific signals that matter to their business.
Threshold-based alerts can notify teams when ticket volume, resolution time, or CSAT crosses a defined limit. This isn't machine learning-based anomaly detection, but for many teams, well-configured threshold alerts are sufficient for catching the most impactful anomalies. The drill-down capabilities by channel, agent, and ticket category make it easier to investigate once an alert fires.
Key Features
Pre-Built and Custom Dashboards: Ready-to-use dashboards for common support metrics, with full customization available through the report builder.
Scheduled and Triggered Alerts: Notifications when key metrics cross defined thresholds, delivered via email or Slack.
Trend Analysis: Historical trend views across ticket volume, resolution time, and CSAT with configurable time windows.
Drill-Down Capabilities: Slice data by channel, agent, ticket category, and custom fields for root cause investigation.
Native Integration: Zero additional integration required for Zendesk users, with full access to all ticket data.
Best For
Support operations teams running on Zendesk who want solid reporting and alerting without managing a separate analytics tool. Teams needing predictive or ML-based detection will find Explore's threshold approach limiting.
Pricing
Included in Zendesk Suite plans. Standalone Explore pricing varies by plan tier.
5. Freshdesk Analytics (Freshworks)
Best for: Freshdesk users who want AI-powered trend detection without leaving their helpdesk
Freshdesk Analytics, powered by Freddy Insights, provides automated trend detection and anomaly-aware reporting across Freshdesk ticket data.
Where This Tool Shines
Freddy Insights is Freshworks' AI analytics layer, and it goes a step beyond basic threshold alerting. Rather than requiring a support manager to define every alert condition manually, Freddy proactively surfaces anomalies and trend changes in plain language. That's a meaningful difference for lean teams that don't have dedicated analytics resources.
The predictive SLA breach reporting is particularly useful: the system flags tickets likely to breach before they actually do, giving agents time to intervene. Combined with curated dashboards for ticket volume and agent performance, Freshdesk Analytics covers the core monitoring needs for most Freshdesk-native teams without any additional tooling.
Key Features
Freddy Insights: AI-powered automated anomaly detection and trend summaries delivered proactively, without requiring manual alert configuration.
Predictive SLA Reporting: Flags potential SLA breaches before they occur, enabling proactive intervention.
Curated Dashboards: Pre-built views for ticket volume, agent performance, and CSAT with minimal setup required.
Custom Report Builder: Scheduled report delivery and custom metric tracking for teams with specific monitoring needs.
Native Integration: Zero additional integration required for Freshdesk users.
Best For
Freshdesk customers on the Growth plan or above who want AI-assisted anomaly detection as part of their existing helpdesk. Not suited for teams on other helpdesk platforms.
Pricing
Freshdesk plans start at $15 per agent per month. Freddy Insights is available on the Growth plan and above.
6. Grafana
Best for: Technical teams that want full control over custom support monitoring dashboards
Grafana is an open-source observability and data visualization platform that technical teams can configure to monitor support data alongside infrastructure metrics with custom anomaly detection.
Where This Tool Shines
Grafana's power is its flexibility. If you want to build a single dashboard that shows ticket volume, error rates, deployment events, and CSAT trends side by side, Grafana can do it. The plugin ecosystem includes connectors for Zendesk and Freshdesk, and any support platform with an API can be ingested as a custom data source.
Grafana ML adds machine learning-based anomaly detection on top of the visualization layer, enabling adaptive baselines rather than static thresholds. The alerting engine supports multi-channel notifications, so anomalies can trigger Slack messages, PagerDuty incidents, or email alerts depending on severity. The tradeoff is setup time: Grafana rewards teams with technical resources and penalizes those without them.
Key Features
Highly Customizable Dashboards: Ingest support data via API or plugins and visualize it alongside any other data source your team cares about.
Grafana ML Anomaly Detection: Machine learning-based detection with adaptive baselines, configurable directly within the platform.
Multi-Channel Alerting: Notifications via Slack, PagerDuty, email, and other channels with configurable routing rules.
Plugin Ecosystem: Community and enterprise plugins for Zendesk, Freshdesk, and hundreds of other data sources.
Open-Source Core: Self-hosted deployment option with no licensing cost, plus a managed Grafana Cloud option.
Best For
Engineering-led support operations or platform teams that want maximum customization and are comfortable with configuration overhead. Not recommended for non-technical support managers looking for out-of-the-box anomaly detection.
Pricing
Open-source version is free to self-host. Grafana Cloud has a free tier, with Pro plans starting at approximately $8 per user per month.
7. Mixpanel
Best for: Product teams that want to catch behavioral anomalies before they become support spikes
Mixpanel is a product analytics platform that tracks user behavior anomalies, useful for identifying upstream behavioral shifts that predict support contact surges before tickets arrive.
Where This Tool Shines
Mixpanel operates upstream of your support inbox. Instead of detecting anomalies in ticket data after users have already reached out, it surfaces behavioral signals earlier in the journey: feature abandonment spikes, funnel drop-offs, and retention changes that often precede support contact surges by hours or days.
For product teams, this is genuinely valuable. If a new feature release causes a drop-off in a critical user flow, Mixpanel can surface that before your support team sees a wave of "how do I do X" tickets. The integration with Intercom and Zendesk allows teams to correlate behavioral anomalies with actual support contact data, creating a more complete picture of what's going wrong and for which user segments.
Key Features
Behavioral Anomaly Detection: Event-based tracking with anomaly alerts on user flows, funnels, and retention metrics.
Funnel and Retention Analysis: Identifies drop-off anomalies in user journeys that correlate with downstream support spikes.
Cohort Analysis: Pinpoints which user segments are driving unusual contact rates, enabling targeted intervention.
Support Stack Integration: Connects with Intercom and Zendesk for cross-platform signal correlation.
Configurable Metric Alerts: Threshold and change-based alerts with adjustable sensitivity for key behavioral metrics.
Best For
Product teams and growth teams at SaaS companies who want early warning signals before support volume spikes. Works best as a complement to a helpdesk-native tool rather than a standalone support monitoring solution.
Pricing
Free plan available. Growth plan starts at approximately $28 per month. Enterprise pricing available on request.
8. Tableau with Einstein Discovery (Salesforce)
Best for: Enterprise teams with dedicated data resources and large-scale support datasets
Tableau with Einstein Discovery is an enterprise BI platform paired with Salesforce's AI layer, offering advanced statistical anomaly detection across large support datasets with natural language explanations.
Where This Tool Shines
At enterprise scale, anomaly detection becomes a data problem as much as a tooling problem. Tableau handles large, multi-channel support datasets that would overwhelm lighter analytics tools, and Einstein Discovery adds the AI layer that turns raw data into actionable insight. The natural language explanations are particularly useful for executive reporting: instead of a chart that shows something changed, Einstein tells you what changed, why it likely happened, and what to do about it.
For organizations already running on Salesforce Service Cloud, the integration depth is a significant advantage. Support data, CRM data, and case history are available in the same analytical environment, enabling the kind of cross-functional anomaly analysis that requires stitching together multiple tools in other setups.
Key Features
Einstein Discovery Anomaly Detection: Automated statistical anomaly detection with AI-generated explanations of root causes and recommended actions.
Natural Language Summaries: Plain-language descriptions of what changed, why it changed, and what to do next, accessible to non-technical stakeholders.
Large-Scale Dataset Handling: Designed for enterprise-scale support operations across multiple channels, regions, and business units.
Salesforce Service Cloud Integration: Native CRM and support data correlation without additional data pipeline work for Salesforce customers.
Advanced Visualizations: Highly customizable dashboards for operational, executive, and analytical reporting use cases.
Best For
Enterprise organizations with dedicated data or BI teams, particularly those already in the Salesforce ecosystem. The licensing cost and setup complexity make this a poor fit for small or mid-market teams without dedicated analytics resources.
Pricing
Tableau Creator licenses start at approximately $75 per user per month. Einstein Discovery requires additional Salesforce licensing.
Choosing the Right Tool for Your Team
The right choice here depends heavily on your existing stack, your team's technical capacity, and where in the support lifecycle you most need visibility.
If you're a B2B SaaS team that wants anomaly detection embedded in your support workflow with cross-stack business intelligence, Halo AI is the strongest fit. The smart inbox surfaces signals where your team already works, and the continuous learning architecture means detection improves without manual tuning. It's the only tool on this list where anomaly detection, AI-powered ticket resolution, and revenue intelligence all live in the same place.
If you're a Zendesk shop that just needs solid dashboards and threshold alerts, Zendesk Explore covers the basics without adding tools to your stack. Freshdesk users get a similar native experience with Freddy Insights, plus the added benefit of AI-generated trend summaries. Intercom users already have conversation analytics built in and may not need anything beyond what's already available on their plan.
For teams that want to correlate support anomalies with infrastructure events, Datadog is the clear choice, though it requires technical resources to set up properly. Grafana offers similar power with more flexibility and a lower licensing cost, but with even more configuration overhead. Mixpanel is the right pick for product teams who want to catch behavioral signals before they hit the inbox.
Enterprise teams running on Salesforce with dedicated data resources will find Tableau and Einstein Discovery the most capable option for large-scale, multi-channel analysis.
Your support team shouldn't scale linearly with your customer base. Let AI agents handle routine tickets, guide users through your product, and surface business intelligence while your team focuses on complex issues that need a human touch. See Halo in action and discover how continuous learning transforms every interaction into smarter, faster support.