9 Best Support Ticket Analytics Tools in 2026
Discover the 9 best support ticket analytics tools in 2026 that go beyond basic reporting to deliver actionable insights—helping support leaders identify churn risks, diagnose product issues, and understand ticket trends. Evaluated on analytics depth, helpdesk integration, and real-world utility, this guide helps B2B SaaS teams transition from reactive support to proactive, data-driven customer operations.
Support teams are drowning in ticket data but starving for actionable insights. Knowing your average resolution time is useful, but understanding why certain ticket categories spike on Mondays, which customers are at churn risk, or where your product is quietly breaking? That's where support ticket analytics tools earn their keep.
This list covers tools that go beyond basic reporting to give support leaders, product teams, and CX managers real intelligence from their ticket data. Whether you're running a lean startup support team or scaling enterprise operations across multiple channels, there's a tool here built for your situation.
We evaluated each tool on depth of analytics, ease of integration with common helpdesks, actionability of insights, and value for B2B SaaS teams specifically. Tools are ranked by overall utility for teams looking to move from reactive support to proactive, data-driven operations.
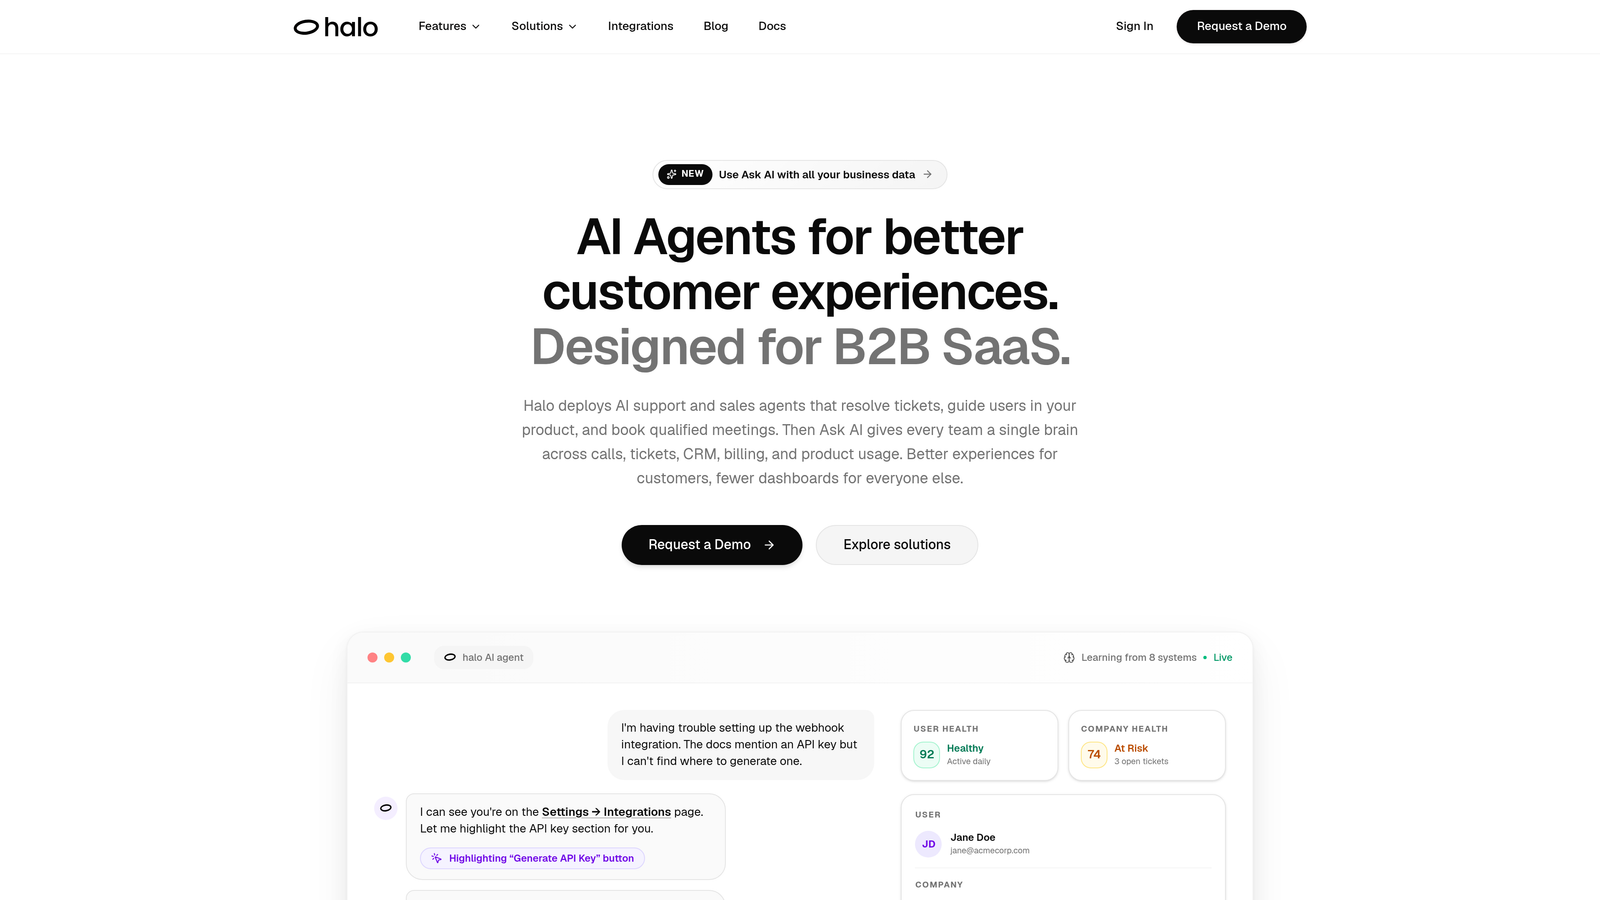
1. Halo AI
Best for: B2B SaaS teams that want support data to drive product and CS decisions
Halo AI is an AI-native customer support platform with a Smart Inbox that surfaces business intelligence rather than just ticket volume metrics.
Where This Tool Shines
Most analytics tools tell you what happened. Halo AI is built to tell you what it means. The Smart Inbox goes beyond operational dashboards by surfacing customer health signals, revenue context, and anomaly detection alongside your ticket queue. That means a support leader can see, in one view, that a spike in billing tickets correlates with a specific customer segment that's already showing churn risk signals.
The AI-first architecture is worth noting because it's not a reporting layer bolted onto an existing helpdesk. Every ticket interaction trains the system, improving categorization accuracy and trend detection over time. And because Halo is page-aware, it captures where users are in your product when they reach out, giving your analytics the kind of contextual depth that generic helpdesks simply can't provide.
Key Features
Smart Inbox with Business Intelligence: Surfaces customer health signals, revenue intelligence, and anomaly detection alongside ticket data, connecting support activity to business outcomes.
Continuous Learning AI Agents: AI agents learn from every interaction, progressively improving ticket categorization and trend identification without manual retraining.
Page-Aware Context: Captures exactly where users are in your product when tickets are created, adding product usage context to every analytics data point.
Auto Bug Ticket Creation: Automatically identifies and routes bug patterns into Linear or Jira, feeding issue frequency data directly into your engineering workflow.
Cross-Stack Integrations: Native connections to HubSpot, Slack, Intercom, Stripe, Zoom, PandaDoc, and Fathom enable analytics that span your entire business stack, not just your support queue.
Best For
B2B SaaS product teams and support leaders who want analytics that connect ticket data to customer health, revenue signals, and product quality, rather than teams that need only basic volume and SLA reporting.
Pricing
Contact for pricing. See haloagents.ai for details. Given the platform's cross-stack intelligence capabilities, it's positioned for teams with meaningful support volume and a need for business-level analytics.
2. Zendesk Explore
Best for: Teams already running operations on Zendesk Suite who need deep native reporting
Zendesk Explore is the native analytics and reporting layer built into Zendesk Suite, offering pre-built dashboards and a custom query builder for established Zendesk users.
Where This Tool Shines
If your support operation already lives in Zendesk, Explore is the natural starting point for analytics. The pre-built dashboards cover the essentials well: ticket volume trends, SLA compliance, agent performance, and CSAT scores are all available without any configuration. For teams that want to go deeper, the Custom Query Language (CUQL) lets analysts build bespoke reports without exporting data to a separate BI tool.
The multi-channel reporting capability is particularly strong for enterprise teams managing support across email, chat, voice, and social simultaneously. Live dashboard sharing also makes it easy to give team leads and stakeholders visibility without requiring them to log into Zendesk directly.
Key Features
Pre-Built Dashboards: Ready-to-use views for ticket volume, SLA compliance, agent performance, and CSAT with no setup required.
Custom Query Language (CUQL): A purpose-built query tool for creating custom reports without needing external BI tools or SQL expertise.
Live Dashboard Sharing: Shareable dashboards that give team leads and stakeholders real-time visibility into support performance.
Multi-Channel Reporting: Unified reporting across email, chat, voice, and social channels in a single view.
Industry Benchmarks: Optional benchmark comparisons against industry data to contextualize your team's performance metrics.
Best For
Mid-market and enterprise support teams already invested in the Zendesk ecosystem who want robust native analytics without managing a separate analytics platform. Less compelling if you're not on Zendesk.
Pricing
Included in Zendesk Suite Growth and above. Suite Growth starts at approximately $89/agent/month. Verify current pricing at zendesk.com, as SaaS pricing changes frequently.
3. Freshdesk Analytics
Best for: Growing support teams on Freshdesk that want accessible reporting without SQL
Freshdesk Analytics is the built-in reporting suite within Freshdesk, offering drag-and-drop report building, CSAT tracking, and SLA compliance monitoring.

Where This Tool Shines
Freshdesk Analytics earns points for accessibility. The drag-and-drop report builder means support managers can build custom reports without involving a data analyst, which matters enormously for lean teams. CSAT trend analysis goes a step further by allowing satisfaction correlation reports, helping teams understand which ticket types or agents are driving satisfaction outcomes rather than just tracking a top-line score.
The scheduled report delivery feature is a small but practical detail that separates it from more basic reporting tools. Stakeholders receive relevant data automatically rather than having to log in and pull it themselves, which keeps analytics visible across the organization.
Key Features
Drag-and-Drop Report Builder: Build custom reports visually without SQL or technical expertise, making analytics accessible to non-technical team leads.
CSAT Trend Analysis: Satisfaction correlation reports that connect CSAT scores to specific ticket types, agents, or time periods.
SLA Compliance Tracking: Monitors SLA performance with breach alerts so teams can act before commitments are missed.
Agent and Group Dashboards: Performance breakdowns by individual agent and team group for coaching and workload management.
Scheduled Report Delivery: Automated email delivery of reports on a set schedule, keeping stakeholders informed without manual effort.
Best For
Small to mid-sized support teams running on Freshdesk who need solid operational reporting without the complexity or cost of a separate analytics platform. Particularly well-suited for teams without dedicated data resources.
Pricing
Included in Freshdesk Growth plan and above. Growth starts at approximately $15/agent/month. Verify current pricing at freshworks.com.
4. Intercom Reports
Best for: Teams using Intercom across support, sales, and marketing who need unified conversation analytics
Intercom Reports is the reporting module within Intercom, covering conversation analytics across the full customer communication lifecycle.
Where This Tool Shines
Intercom's reporting advantage comes from its cross-functional position. Because many companies use Intercom for support, sales outreach, and marketing messages simultaneously, the reporting module can surface analytics that span all three touchpoints. That's a meaningful difference from helpdesk-only analytics, where support data exists in a silo disconnected from earlier stages of the customer journey.
Tag and topic reporting is a standout for categorization-focused teams. When your team consistently tags conversations, Intercom's reporting can surface issue trends by topic over time, giving product and support leaders a reliable signal on what's growing as a problem category before it becomes a crisis.
Key Features
Conversation Volume and Response Time Tracking: Monitors volume and speed across all channels in a unified dashboard.
CSAT and Satisfaction Trends: Tracks customer satisfaction scores and trends over time with conversation-level context.
Teammate Performance Analytics: Workload distribution and performance metrics across individual team members.
Tag and Topic Reporting: Issue categorization analytics based on conversation tags, enabling trend tracking by problem type.
Funnel and Engagement Analytics: Lifecycle-level analytics connecting support data to broader customer engagement patterns.
Best For
Companies using Intercom as their primary customer communication layer who want analytics that span support, sales, and marketing conversations rather than support alone.
Pricing
Reporting features are included across Intercom plans. Pricing starts at approximately $39/month for small teams. Verify current pricing at intercom.com.
5. Gorgias Analytics
Best for: E-commerce support teams on Shopify that need revenue attribution tied to ticket data
Gorgias Analytics is purpose-built for e-commerce support teams, with direct Shopify revenue attribution that connects ticket activity to order data.
Where This Tool Shines
Gorgias does something most support analytics tools don't: it tells you how much revenue your support team is generating, not just how efficiently it's operating. Revenue-per-ticket metrics tied directly to Shopify order data let e-commerce teams measure the actual business impact of support interactions, including which agents and conversation types are most likely to convert or retain customers.
Ticket volume forecasting by channel and category is another practical differentiator, particularly for e-commerce teams managing predictable volume spikes around promotions, launches, or seasonal events. The automation performance reports showing ticket deflection rates also help teams quantify the ROI of their self-service investments.
Key Features
Revenue-Per-Ticket Metrics: Direct Shopify integration that attributes revenue to support conversations, measuring business impact alongside operational performance.
Agent Performance Dashboards: Response time and performance metrics broken down by individual agent.
Ticket Volume Forecasting: Predictive volume trends by channel and category to support staffing decisions.
CSAT Tracking: Customer satisfaction trend analysis across support interactions.
Automation Performance Reports: Deflection rate reporting that quantifies the impact of self-service and automation investments.
Best For
E-commerce brands running on Shopify that want to connect support analytics to revenue outcomes. Less relevant for B2B SaaS teams or companies not on Shopify.
Pricing
Gorgias plans start at approximately $10/month, with analytics features available across tiers. Verify current pricing at gorgias.com.
6. Zoho Desk Reports
Best for: SMBs already in the Zoho ecosystem that need affordable cross-platform ticket analytics
Zoho Desk Reports is the native reporting module within Zoho Desk, connecting ticket analytics to Zoho CRM customer data for cross-platform visibility.
Where This Tool Shines
The key differentiator here is the native Zoho CRM integration. For SMBs already using Zoho's suite, Zoho Desk Reports can surface customer-level ticket context directly alongside CRM data, giving support agents and managers a fuller picture of who they're supporting without switching between platforms. That kind of cross-system visibility usually requires a more complex integration setup in other tools.
At its price point, Zoho Desk Reports covers the fundamentals well. Pre-built and custom report templates handle ticket trends and agent performance without requiring technical setup, and scheduled report sharing keeps stakeholders informed automatically.
Key Features
Pre-Built and Custom Report Templates: Ready-to-use reports for ticket trends and agent performance alongside a custom builder for specific needs.
Native Zoho CRM Integration: Customer-level ticket context pulled directly from Zoho CRM for richer support analytics.
Happiness Ratings (CSAT) Tracking: Satisfaction score tracking and trend analysis across support interactions.
SLA Compliance and Breach Reporting: Monitors SLA performance and flags breaches before they escalate.
Scheduled Report Sharing: Automated delivery and dashboard embedding for stakeholder visibility.
Best For
SMBs already invested in the Zoho ecosystem who want affordable support analytics with native CRM connectivity. Teams outside the Zoho stack will find less compelling reasons to choose this over alternatives.
Pricing
Included in Zoho Desk Standard and above. Standard starts at approximately $14/agent/month. Verify current pricing at zoho.com.
7. Help Scout Reports
Best for: Small support teams that want clean, simple reporting without analytics overhead
Help Scout Reports is a straightforward reporting suite built into Help Scout, focused on team productivity, happiness ratings, and conversation metrics.
Where This Tool Shines
Help Scout Reports is deliberately simple, and that's a feature, not a limitation, for the teams it serves. Small support teams often don't need a complex analytics platform: they need to know if customers are happy, how fast the team is responding, and when they're likely to get slammed with volume. Help Scout covers all three without requiring any configuration or technical expertise.
The busy times heatmap is a practical standout for small teams managing staffing with limited resources. Seeing exactly when conversation volume peaks by hour and day of week makes scheduling decisions straightforward. Company and user-level conversation history reports also give teams a quick way to understand individual customer context without a CRM integration.
Key Features
Happiness Ratings (CSAT): Conversation-level customer feedback with trend analysis over time.
Team Productivity Reports: Replies sent, conversations handled, and response times by team member.
Conversation Volume Trends: Volume tracking by channel and mailbox over customizable time periods.
Busy Times Heatmap: Hour-by-hour and day-by-day volume visualization for staffing optimization.
Company and User-Level History: Conversation history reports at the individual customer and company level.
Best For
Small support teams that want clean, readable reporting without complexity. Teams that need advanced analytics, AI-driven insights, or deep integration with CRM and product tools will quickly outgrow it.
Pricing
Reports included in Help Scout Standard plan and above. Standard starts at approximately $22/user/month. Verify current pricing at helpscout.com.
8. Tableau
Best for: Enterprise organizations with dedicated data teams that need maximum analytical flexibility
Tableau is an enterprise BI platform that, when connected to helpdesk data via native connectors or exports, offers unmatched analytical flexibility for organizations with data engineering resources.
Where This Tool Shines
Tableau's strength is its ceiling, not its floor. There is no analytics use case it can't handle if you have the data and the team to work with it. For support organizations that want to blend ticket data with CRM data, product usage data, and financial data in a single view, Tableau is one of the few platforms that makes this genuinely feasible without custom engineering work.
The tradeoff is real, though. Tableau requires data engineering resources to connect helpdesk data properly, and the time-to-insight is longer than any native helpdesk reporting tool. It's the right choice for organizations where support analytics is one part of a broader data strategy, not for teams looking to get reporting up and running quickly.
Key Features
Full BI Flexibility: Build any visualization from raw ticket data with complete control over metrics, dimensions, and chart types.
Native Connectors and API Imports: Connects to major helpdesk platforms via native connectors or CSV and API imports.
Cross-System Data Blending: Combine support, CRM, and product data in a single analytical view.
Interactive Dashboards: Drill-down dashboards that let stakeholders explore data without requiring analyst support.
Enterprise Access Controls: Role-based access, scheduled data refreshes, and enterprise-grade governance for large organizations.
Best For
Enterprise organizations with dedicated data or analytics teams who want support data integrated into a broader business intelligence strategy. Not recommended for teams without data engineering resources or those needing fast time-to-insight.
Pricing
Tableau Creator starts at approximately $75/user/month. Note that meaningful helpdesk integration will also require data engineering time. Verify current pricing at tableau.com.
9. Klaus (Klausapp)
Best for: Support teams formalizing conversation quality programs and agent coaching
Klaus is an AI-powered conversation quality and QA analytics platform that scores support interactions, identifies coaching opportunities, and tracks quality trends across all ticket channels.
Where This Tool Shines
Klaus occupies a distinct niche in the support analytics landscape: it's not about ticket volume or SLA compliance, it's about quality. The AutoQA feature uses AI to score 100% of conversations without requiring manual review, which is a meaningful shift from traditional QA programs where reviewers can only sample a fraction of interactions. That coverage makes quality trend data far more reliable and representative.
The correlation between quality scores and CSAT outcomes is particularly valuable for teams trying to build a data-driven case for coaching investments. Rather than arguing that quality matters in the abstract, Klaus lets you show the relationship between conversation quality scores and actual customer satisfaction results. Klaus was acquired by Zendesk in 2024 but continues to operate as a standalone product across multiple helpdesk platforms.
Key Features
AI-Powered AutoQA: Scores 100% of conversations automatically without manual reviewer sampling, providing complete quality coverage.
Custom Quality Scorecards: Build scorecards aligned to your team's specific quality standards and evaluation criteria.
Agent Coaching Analytics: Performance trend tracking by agent to identify coaching opportunities and measure improvement over time.
Quality-to-CSAT Correlation: Analytics connecting quality scores to customer satisfaction outcomes to quantify the business impact of quality programs.
Cross-Platform Support: Works with Zendesk, Intercom, Freshdesk, and other major helpdesk platforms.
Best For
Support teams of 10 or more agents that are formalizing QA programs, investing in structured coaching, or trying to understand the relationship between conversation quality and customer outcomes. Less relevant for very small teams or those focused purely on volume and speed metrics.
Pricing
Contact Klaus for current pricing at klausapp.com. Pricing details may have evolved following the Zendesk acquisition in 2024.
Which Tool Is Right for Your Team?
The best support ticket analytics tool depends on what question you're actually trying to answer. Here's a quick-reference guide to cut through the noise.
For B2B SaaS teams that want analytics connected to customer health, churn signals, and product quality: Halo AI's Smart Inbox is built specifically for this use case, surfacing business intelligence that goes well beyond operational metrics.
For teams already on a specific helpdesk platform: Start with the native reporting tool. Zendesk Explore, Freshdesk Analytics, Intercom Reports, Zoho Desk Reports, and Help Scout Reports are all solid for their respective ecosystems, and they're included in your existing subscription.
For e-commerce teams on Shopify: Gorgias Analytics is the clear choice given its revenue attribution capabilities.
For teams formalizing QA and agent coaching programs: Klaus is in a category of its own for conversation quality analytics.
For enterprise organizations with data teams: Tableau gives you maximum flexibility when support analytics is part of a broader BI strategy.
The broader trend worth noting: support teams that treat ticket data as a business intelligence source, rather than just an operational reporting function, consistently find more value from their analytics investment. Tools that connect support signals to customer health, product quality, and revenue context are becoming the standard expectation, not a premium feature.
Your support team shouldn't scale linearly with your customer base. Let AI agents handle routine tickets, guide users through your product, and surface business intelligence while your team focuses on complex issues that need a human touch. See Halo in action and discover how continuous learning transforms every interaction into smarter, faster support.