What Is Deflection Rate? AI Support Metrics Explained
What Is Deflection Rate. Learn what deflection rate is, how to calculate it accurately, and how AI support tools transform self-service resolution
 Grant CooperFounder11 min read
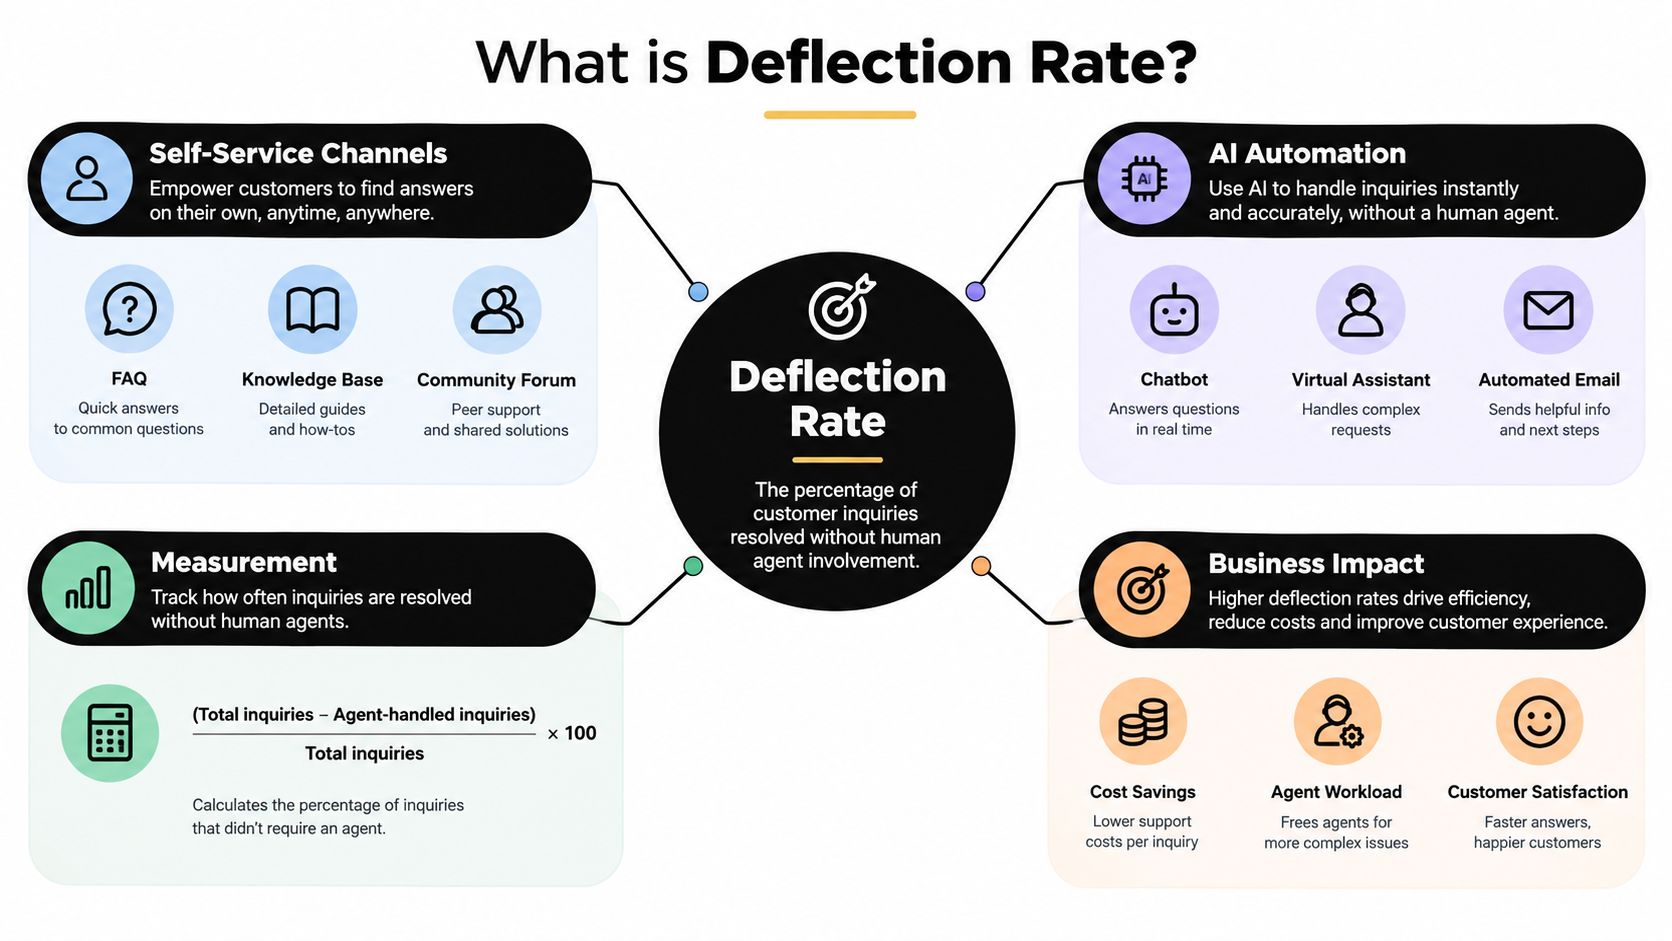
Deflection rate is the percentage of customer inquiries resolved through self-service or automation before reaching a human agent, calculated as deflected contacts divided by total contact attempts multiplied by 100. A simple industry example is 3,500 issues resolved without an agent out of 10,000 inquiries, which equals a 35% deflection rate.
That definition sounds straightforward. The measurement isn't. Teams say they want deflection, but what they need is proof that customers finished the task, found the answer, or solved the problem without circling back later. That distinction matters more now because AI agents don't just redirect users to articles. They can guide people inside the product, complete workflow steps, and prevent a ticket by resolving the issue before support ever touches it.
Defining Deflection Rate in Modern Support
The cleanest answer to what is deflection rate starts with the queue. Deflection rate measures how much incoming support demand never reaches a human because self-service or automation handled it first. In operational terms, that usually means a help center, chatbot, IVR, or AI agent solved the issue before an agent got involved.
The important word is solved. A customer who gives up after reading an unhelpful article shouldn't count as deflected. Industry definitions are explicit on that point in the Decagon explanation of deflection rate. A contact only counts as deflected if the underlying issue is resolved.
Why the denominator matters
A lot of support metrics begin after a ticket exists. Deflection rate doesn't. It uses total demand as the denominator, which makes it a measure of prevention, not just handling efficiency. That sounds subtle, but it changes how support leaders interpret performance.
If your team improves handle time, you've optimized work after contact creation. If your team improves deflection rate, you've reduced the number of contacts that ever require agent time. That's why the metric became widely used as self-service matured in the 2010s and then became a default scorecard for AI customer service tools in the 2020s, as outlined in Decagon's glossary.
Practical rule: Count prevented support load, not vanished clicks.
What deflection rate is not
Deflection rate often gets confused with abandonment rate. They are not the same metric.
- Abandonment tracks drop-off: A user leaves a flow, closes chat, or exits the help center without necessarily solving anything.
- Deflection tracks resolved demand: The issue is handled before a human gets involved.
- Containment tracks channel staying power: The interaction remained inside automation, which still doesn't guarantee resolution.
Teams building a measurement model often start with channel definitions, workflow tags, and escalation criteria before they ever touch reporting. A useful reference for operational design is this playbook for support reps, especially if you're standardizing how reps classify escalations. For a closer look at the broader ticket-avoidance strategy, Halo's guide to ticket deflection strategy is a helpful companion.
How to Calculate Deflection Rate Correctly
You can calculate deflection rate loosely or strictly. The loose model is easier to implement. The strict model is harder to game.
Formula one for channel tracking
For a broad support program, a standard formula is:
Deflection rate = self-service resolutions ÷ total inquiries × 100
That definition is consistent with the Mindmesh glossary on deflection rate. It works well when your instrumentation can identify which issues were resolved through automation or self-service.
For knowledge bases, many teams use a more channel-specific formula:
KB deflection rate = (KB sessions − tickets opened from KB) ÷ KB sessions
That formula comes from the Re:Work support metrics guide. It answers a narrower question: after someone visited the knowledge base, how often did that session avoid turning into a ticket?
Formula two for stricter measurement
A stronger benchmark-style formula is:
Self-service resolutions ÷ (self-service resolutions + tickets created)
The same Re:Work support metrics guide notes that some teams only count a self-service interaction as successful if there's an explicit success signal and no ticket appears within 72 hours. That requirement matters because self-service systems tend to overstate success when they count interaction volume rather than completed outcomes.
If your bot reports success every time a conversation ends, you're measuring exits, not resolution.
A worked example
The industry example from Decagon's deflection rate definition is still the cleanest way to see the math: 10,000 inquiries with 3,500 resolved without an agent equals a 35% deflection rate.
That example is simple enough for executives and precise enough for operations. It also exposes the risk. If some portion of those 3,500 were abandoned sessions rather than true resolutions, the reported rate would look healthy while agent demand stayed stubbornly high.
A practical reporting stack usually pairs deflection with escalation trends, repeat contacts, and channel conversion checks. If you're formalizing that stack, Halo's overview of customer support metrics is a solid framework for deciding which numbers belong on the same dashboard.
Traditional Self-Service Versus AI-Driven Deflection
Traditional self-service and AI-driven deflection can produce the same headline outcome. Fewer tickets hit the queue. They do not get there in the same way.
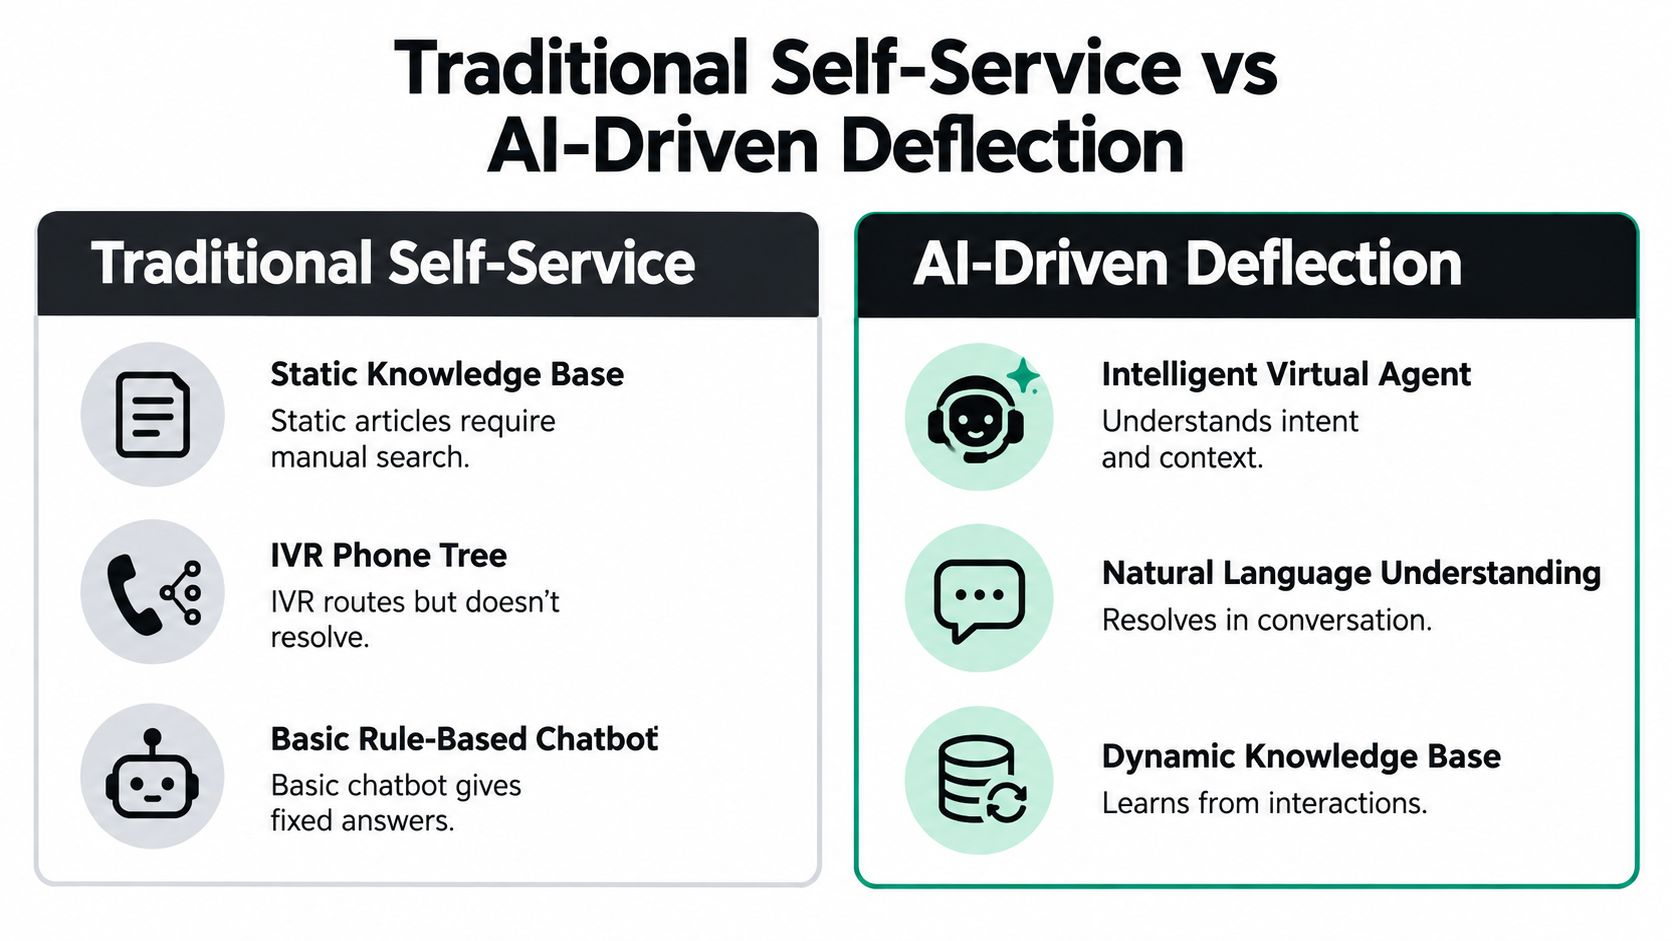
Traditional systems mostly route people to information. AI systems can increasingly complete the job.
How older self-service deflects
Classic self-service channels include knowledge bases, FAQ pages, community forums, IVR trees, and basic rule-based chatbots. They work best when customers know what they need and the answer already exists in a findable format.
The strengths are obvious. These systems scale well for repetitive questions and stable workflows. The weakness is just as obvious. They usually require the customer to search, interpret, and execute the answer on their own.
A mature knowledge-base program can still be valuable. But the ceiling is tied to article quality, search quality, and issue complexity.
How AI changes the math
The under-discussed shift is that AI agents don't have to stop at answer delivery. In modern SaaS support, an agent can identify intent, use product context, guide a user on the current screen, and resolve the issue in-product. That creates a measurement problem for teams still using ticket avoidance as the only success condition.
The benchmark picture in projected 2026 data is already messy. One source reports median AI self-service deflection at 22% across a range of 8% to 45%, while enterprise tier-1 deflection is reported around 41.2% with a top quartile near 58.7%, and mature knowledge-base programs are often described as only 15% to 40% deflection depending on the source and setup in Stealth Agents' 2026 deflection research. Those figures are useful, but only if you know what each system counted as success.
Here's the video version of that shift in practice.
The comparison that actually matters
A support leader choosing between models should compare them on what the automation does:
| Model | Primary action | Main measurement risk |
|---|---|---|
| Knowledge base | Presents static answers | Session exits can look like success |
| IVR | Routes requests | Transfer avoidance can be mistaken for resolution |
| Basic chatbot | Handles defined scripts | Containment can hide unresolved issues |
| AI agent | Interprets context and resolves tasks | Ticket-only tracking can miss completed in-product work |
The practical takeaway isn't that AI always wins. It's that AI often creates value that old deflection formulas fail to see. If the system completes a task inside the product, the outcome is resolution. A ticket was never the point.
Deflection Rate Benchmarks for SaaS Businesses
Benchmarks matter because deflection targets get distorted fast. Teams hear a large number from a vendor and assume it should apply to every support environment. It doesn't.
The benchmark ranges below are more useful because they separate maturity level and issue complexity.
What mature programs tend to achieve
For knowledge bases, benchmark sources report about 20% to 40% of inbound tickets deflected, with some deployments reaching 50% or higher, according to Stealth Agents' 2026 knowledge-base statistics. That's a healthy reminder that even strong documentation programs have practical limits.
For issue complexity, the same source cites B2B services deflection estimates of 60% for simple issues, 28% for medium issues, and 5% for complex issues in the same benchmark set. That's the benchmark split many dashboards fail to show.
The fastest way to misread deflection is to blend simple and complex work into one headline number.
A benchmark view by support model
| Support setup | Benchmark signal |
|---|---|
| Mature knowledge base | Often falls in the 20% to 40% range, with some deployments reaching 50% or higher |
| AI self-service median in projected 2026 data | 22%, with a range of 8% to 45% |
| Enterprise tier-1 deflection in projected 2026 data | Around 41.2%, with top quartile near 58.7% |
| Simple B2B issues | Around 60% deflection estimate |
| Medium B2B issues | Around 28% deflection estimate |
| Complex B2B issues | Around 5% deflection estimate |
Those numbers don't tell you what your target should be. They tell you what kind of comparison is legitimate.
How SaaS teams should use the benchmarks
A B2B SaaS company supporting onboarding questions, billing access, product bugs, and integration troubleshooting shouldn't set one universal deflection target. A smarter approach is to benchmark by issue type, channel, and automation scope.
If you're building that KPI model, this guide to key performance metrics for customer service is useful because it places deflection in context with service quality metrics rather than treating it as a standalone win condition.
Avoiding False Positives in Deflection Measurement
False positives are why so many deflection dashboards look strong while support queues don't shrink enough to match. The metric gets inflated when teams treat non-escalation as proof of success.
A stricter model adds two filters. First, look for an explicit success signal. Second, apply a non-recontact window.
Add a time window to your definition
One source defines true deflection as self-service resolutions with no ticket within 72 hours, while another uses a 48-hour re-contact adjustment to remove false positives from abandoned or unresolved sessions in Metabase's deflection rate notes. Those windows force teams to ask the right question. Did the self-service interaction hold up after the customer left?
That matters because unresolved issues often come back through another channel. Without the time-window check, a failed bot session can still inflate the score.
A customer who returns shortly after self-service didn't disappear. The issue did not get solved the first time.
Choose the right unit of analysis
Knowledge-base programs add another wrinkle. You can measure deflection by session or by user.
According to Umbrex's knowledge-base deflection analysis, session-based deflection rate equals true deflected sessions divided by eligible sessions, while user-based deflection rate equals users with at least one true deflected session divided by users with eligible sessions.
That difference changes the story:
- Session-based measurement fits content optimization. It tells you whether article visits are converting into successful self-service outcomes.
- User-based measurement fits customer-level analysis. It shows whether people, not just visits, are succeeding without agent help.
- Mixed reporting creates confusion. A program can look strong on sessions while still frustrating the same users repeatedly.
A quick audit for inflated rates
If your reported deflection looks suspiciously high, review three things first:
- Success criteria: Does the metric require resolution, or only that the interaction ended?
- Recontact logic: Are follow-up tickets inside the chosen window excluded from success?
- Deduplication: Are multiple channel attempts from the same issue being counted as separate wins?
Support ops teams that care about measurement discipline usually pair this work with broader analytics governance. Halo's article on data quality monitoring is a practical reference for keeping definitions and event tracking consistent.
Turning Deflection Insights Into Support Strategy
The teams that get the most value from deflection rate don't chase the biggest percentage. They use the metric to decide where automation should resolve issues, where humans should step in earlier, and which workflows deserve product or content fixes.
Deflection becomes strategic when it sits beside escalation rate, CSAT, and repeat-contact checks. The Mindmesh overview of deflection rate notes that mature implementations use the metric alongside those signals because a high deflection number can be inflated by abandoned sessions or partial answers.
What a strong operating model looks like
A practical SaaS workflow looks something like this:
- Simple requests go first to self-service: Access steps, routine billing questions, and standard how-to issues are good candidates.
- Ambiguous cases escalate fast: If confidence drops or the workflow stalls, the system hands off with context instead of forcing another round of troubleshooting.
- Repeated self-service failures trigger fixes: Teams revise documentation, adjust flows, or change the product experience itself.
That loop turns deflection data into product and operations intelligence instead of dashboard theater.
Where autonomous agents fit
In this model, tools differ by what they can execute. A knowledge base informs. An IVR routes. An autonomous agent can guide users through UI steps, capture context, and sometimes finish the task inside the product before a ticket ever exists.
Halo AI is one example of that approach. It deploys autonomous agents that resolve tickets, guide users through the product, and create bug reports with session context. That matters for deflection because in-product resolution can reduce escalation volume while preserving the details a human or engineering team needs later. For teams evaluating similar systems, Halo's write-up on AI for customer service insights is worth reading alongside your own support workflow map.
Good deflection reduces avoidable work. Bad deflection just delays it.
The long-term shift is clear even if the measurement still needs work. As AI agents become more workflow-aware, support leaders will need scorecards that recognize completed tasks, not just avoided tickets. The companies that get this right won't report lower volume. They'll operate with cleaner queues, better handoffs, and more reliable evidence that automation solved something.
Halo AI gives B2B SaaS teams a way to measure and improve deflection through autonomous support that can resolve issues in-product, guide users on the right screen, and hand off with full context when human help is needed. If you're trying to move from vanity deflection to verified resolution, visit Halo AI to see how that model works in practice.